Stock name: HFCL Ltd.
Pattern: Head and shoulders pattern and retest
Time frame: Daily
Observation:
The stock has been in an upward trend since October 2023 but formed a head and shoulders pattern on the daily chart between June 2024 and January 2025. A breakdown occurred on January 6, 2025, accompanied by average volume, followed by a downward move. While the stock slightly retested the breakdown level, it quickly formed a red candle with high volumes and resumed its decline. Based on technical analysis, the stock may continue to fall further. It's advisable to look for additional confirmations, such as RSI levels and the MACD indicator.
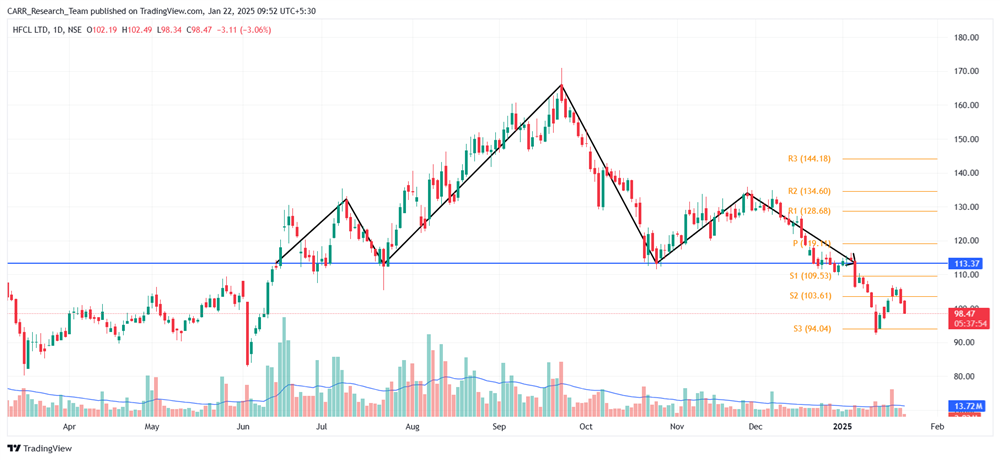
You may add this to your watch list to understand further price action.
Disclaimer: This analysis is purely for educational purpose and does not contain any recommendation. Please consult your financial advisor before taking any financial decision.

Stock name: Multi Commodity Exchange of India Ltd.
Pattern: Double top pattern and retest
Time frame: Daily
Observation:
The stock experienced an upward trend starting in June 2024 but formed a double top pattern on the daily chart between October 2024 and January 2025. A breakdown occurred around January 10, 2025, but it lacked volume and was quickly retested, closing above the breakdown line. On January 21, 2025, the stock saw a sharp decline with high trading volumes. If this momentum persists, it may see further decline as per technical analysis. It's advisable to look for additional confirmations, such as RSI levels and the MACD indicator.
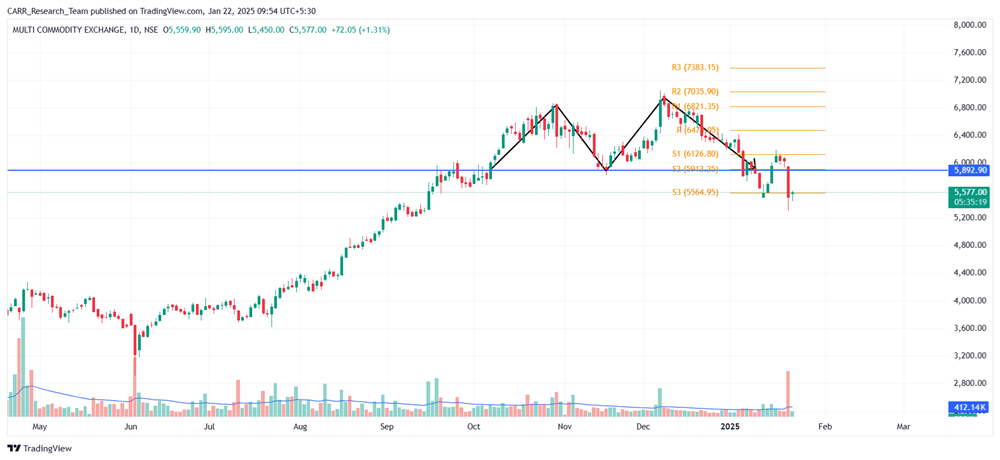
You may add this to your watch list to understand further price action.
Disclaimer: This analysis is purely for educational purpose and does not contain any recommendation. Please consult your financial advisor before taking any financial decision.