India’s hotel industry is witnessing remarkable growth, marked by a surge in branded hotel signups and a rapidly expanding inventory. As per hospitality consultancy Hotelivate, the country is set to add approximately 94,000 branded hotel rooms by 2028-29, complementing the existing inventory of 192,000 rooms. This expansion reflects a robust domestic market and increased penetration of hospitality brands in Tier 2 and Tier 3 cities, shifting the sector’s reliance away from foreign tourist business.
Growth Momentum in Branded Inventory
Between March and August 2024, India’s branded hotel inventory witnessed a net addition of 12,000 rooms, while a further 5,500 rooms were added to the supply pipeline. Manav Thadani, founder chairman of Hotelivate, emphasized this positive trend, underscoring the buoyant demand driving growth.
Among Indian hotel chains, Tata Group-backed Indian Hotels Company Limited (IHCL) is leading the charge with plans to open 17,354 rooms over the next three to four years. Under its ACCELERATE 2030 strategy, IHCL aims to expand its current portfolio from 350 to over 700 hotels by 2030. This aggressive growth strategy is expected to boost its enterprise revenue from ₹13,000 crore to over ₹30,000 crore.
International Players Expand Footprint
Global hotel chains are also scaling up their operations in India. Marriott International, with 153 hotels and 29,000 rooms in its existing inventory, plans to open more than 40 hotels, adding over 6,500 rooms in the next five years. Similarly, Radisson Hotel Group, currently managing 125 hotels with 13,948 rooms, has a pipeline of 81 hotels comprising 7,985 keys.
Radisson has prioritized expanding into Tier 2 and Tier 3 cities, where it is often the sole international brand present. Marriott and Radisson’s strategic focus on smaller cities highlights their commitment to tapping into underserved markets.
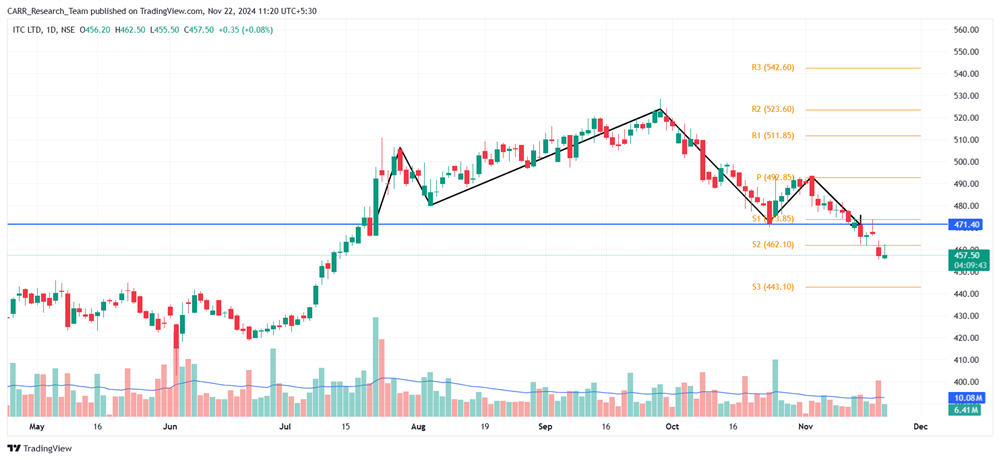
ITC Hotels, another significant player, is also pursuing an ambitious growth agenda. Its current portfolio of 140 hotels with 13,000 rooms is set to expand to 200 hotels with approximately 18,000 keys by 2030. The brand's spokesperson highlighted the company’s focus on quality-driven offerings across luxury, boutique, and experiential segments.
Midscale and Budget Brands Drive Growth
The growth is not limited to luxury and premium segments. Budget and midscale brands such as Lemon Tree Hotels are capitalizing on demand from business and leisure travellers. Lemon Tree is poised to add 4,700 rooms across 70 hotels over the next four to five years.
Hilton and Accor are also rapidly expanding their presence in India. Hilton’s strategic partnership with Olive by Embassy will introduce 150 Spark by Hilton hotels across the country, strengthening its pipeline. This initiative aligns with Hilton’s broader plan to grow its portfolio to 200 hotels, surpassing its earlier goal of tripling its Indian footprint to 75 properties.
Accor, known for its diverse range of brands, has signed deals for hotels in key cultural and religious destinations such as Jaipur, Varanasi, Amritsar, Tirupati, and Bengaluru. Garth Simmons, Accor’s chief operating officer for Asia, emphasized the group’s efforts to cater to India’s dynamic market by bringing global hospitality standards to new locations.
Domestic Market Fuels Expansion
Industry leaders agree that India’s hotel industry is no longer dependent on foreign tourists for growth. Instead, domestic travellers are driving demand across leisure, business, and religious tourism segments. With an expanding middle class, rising disposable incomes, and increased connectivity, Indian travellers are exploring destinations across the country.
Kiran Andicot of Marriott International noted that India’s diverse traveller base is a significant factor shaping the brand’s expansion strategy. Similarly, Hilton’s Zubin Saxena described 2024 as a transformative year, marked by brand launches and new market entries, underscoring the growing importance of the Indian domestic market.
Outlook: A Transforming Landscape
India’s hospitality sector is undergoing a seismic transformation, fuelled by a mix of domestic demand and global investment. As leading players continue to expand their footprints, the sector is expected to cater to an increasingly diverse traveller demographic, ranging from luxury seekers to budget-conscious explorers.
By leveraging this growth momentum, India is positioning itself as a dynamic hub for both global and domestic tourism, creating an unprecedented opportunity for brands to thrive in this burgeoning market.