Filter
RSS

Blog posts of '2024' 'October'

Technical Analysis of RELIANCE & GAEL

Stock name: Reliance Industries Ltd.

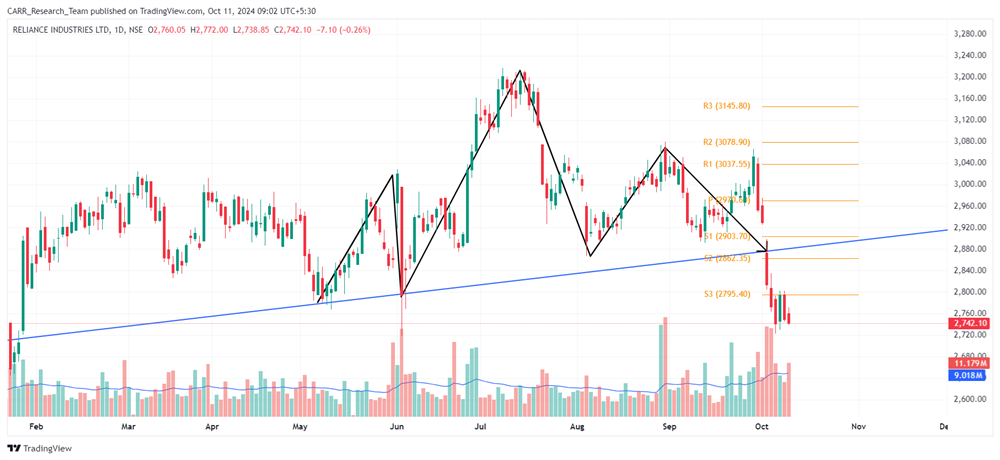
Pattern: Head and shoulders pattern

Time frame: Daily

Observation:

The stock has been in an upward trend since March 2023, but between May and October 2024, it formed a head and shoulders pattern on the daily chart. A breakdown from this pattern occurred on October 3rd, 2024, followed by continued downward movement. Both the breakout and subsequent declines were accompanied by strong trading volume. According to technical analysis, if the stock maintains this momentum, it may decline further. It's advisable to look for additional confirmations, such as RSI levels and the MACD indicator.
You may add this to your watch list to understand further price action.

Disclaimer: This analysis is purely for educational purpose and does not contain any recommendation. Please consult your financial advisor before taking any financial decision.

Stock name: Gujarat Ambuja Exports Ltd.

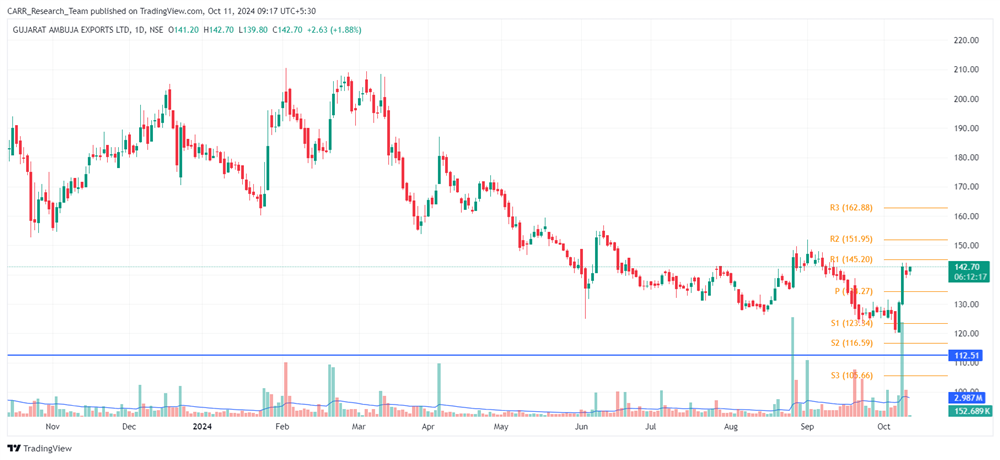
Pattern: Support and reversal (Bullish Engulfing)

Time frame: Daily

Observation:

The stock has been declining since February 2024, nearing a key support level established in 2022. This support has been tested multiple times, making it a strong level. On October 7th and 8th, 2024, the stock formed a bullish engulfing candlestick pattern, followed by a large green candle with significant volume on October 9th. This signals a potential reversal, and if the momentum holds, the stock may move upwards according to technical analysis. It's advisable to look for additional confirmations, such as RSI levels and the MACD indicator.
You may add this to your watch list to understand further price action.

Disclaimer: This analysis is purely for educational purpose and does not contain any recommendation. Please consult your financial advisor before taking any financial decision.

Technical Analysis of RELIANCE & GAEL
Read More
Technical Analysis of LAURUSLABS & PAGEIND

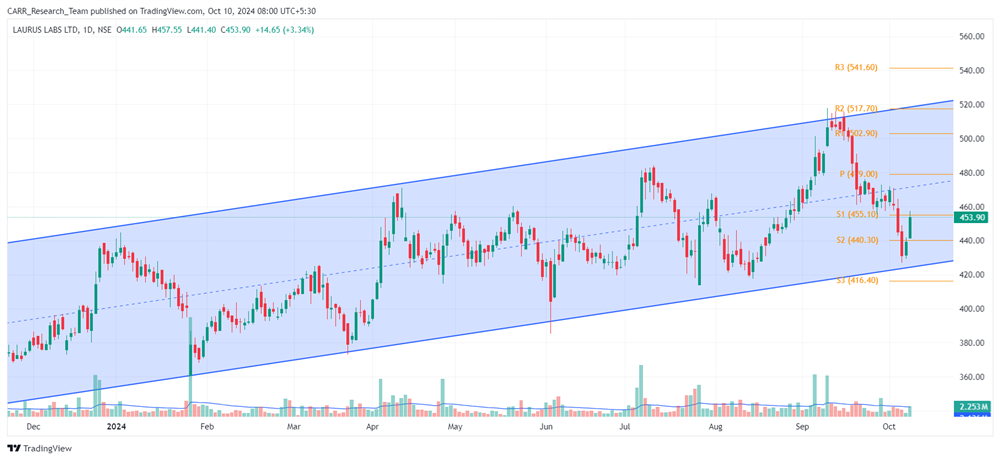
Stock name: Laurus Labs Ltd.

Pattern: Parallel channel

Time frame: Daily

Observation:

Since April 2023, the stock has been moving upward in a parallel channel. It hit resistance on 16th September 2024 and then moved downward, approaching the channel's support. On 8th October 2024, the stock formed a bullish harami candlestick pattern at the support level of the parallel channel, followed by another green candle the next day, confirming the reversal. If the current momentum holds, the stock may see further upward movement within the channel, according to technical analysis. It's advisable to look for additional confirmations, such as RSI levels and the MACD indicator.

You may add this to your watch list to understand further price action.

Disclaimer: This analysis is purely for educational purpose and does not contain any recommendation. Please consult your financial advisor before taking any financial decision.

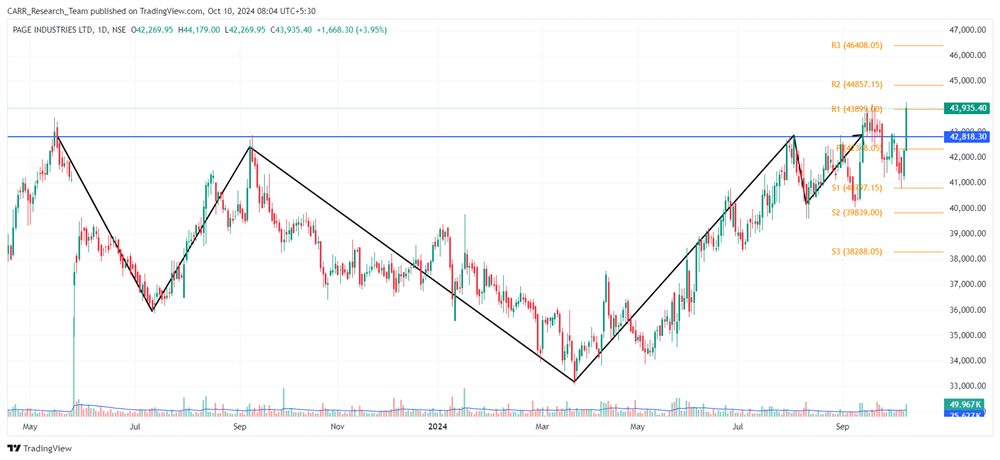
Stock name: Page Industries Ltd.

Pattern: Inverse head and shoulders pattern and retest

Time frame: Daily

Observation:

The stock has been in a downward trend since October 2022. From March 2023 to September 2024, it formed an inverse head and shoulders pattern on the daily chart, breaking out around 11-12 September 2024 with strong volume. After a retest and closing below the breakout line due to market bearishness, the stock rebounded and closed above the breakout line on 9th October 2024 with high volume. If the momentum holds, the stock may see further upward movement based on technical analysis. It's advisable to look for additional confirmations, such as RSI levels and the MACD indicator.

You may add this to your watch list to understand further price action.

Disclaimer: This analysis is purely for educational purpose and does not contain any recommendation. Please consult your financial advisor before taking any financial decision.

Technical Analysis of LAURUSLABS & PAGEIND
Read More
Technical Analysis of APLAPOLLO & RAINBOW

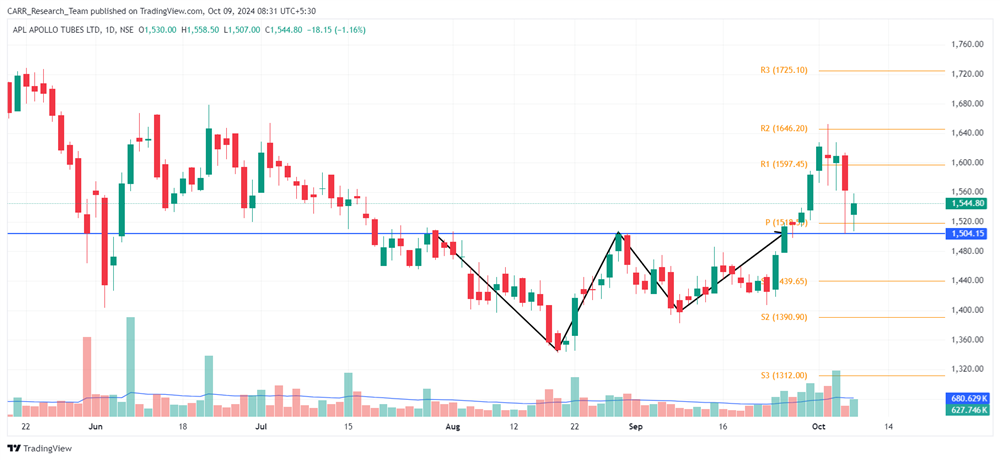
Stock name: APL Apollo Tubes Ltd.

Pattern: Double bottom pattern and retest

Time frame: Daily

Observation:

Since September 2023, the stock has been trending slightly downward. Between July and September 2024, it formed a double bottom pattern, with a breakout occurring on 25th September. Although the stock initially moved upward after the breakout, it retested the breakout level due to the broader market's downtrend. Currently, it is rebounding from the retest but lacks strong momentum. According to technical analysis, if the stock gains sufficient momentum, further upward movement may follow. It's advisable to look for additional confirmations, such as RSI levels and the MACD indicator.

You may add this to your watch list to understand further price action.

Disclaimer: This analysis is purely for educational purpose and does not contain any recommendation. Please consult your financial advisor before taking any financial decision.
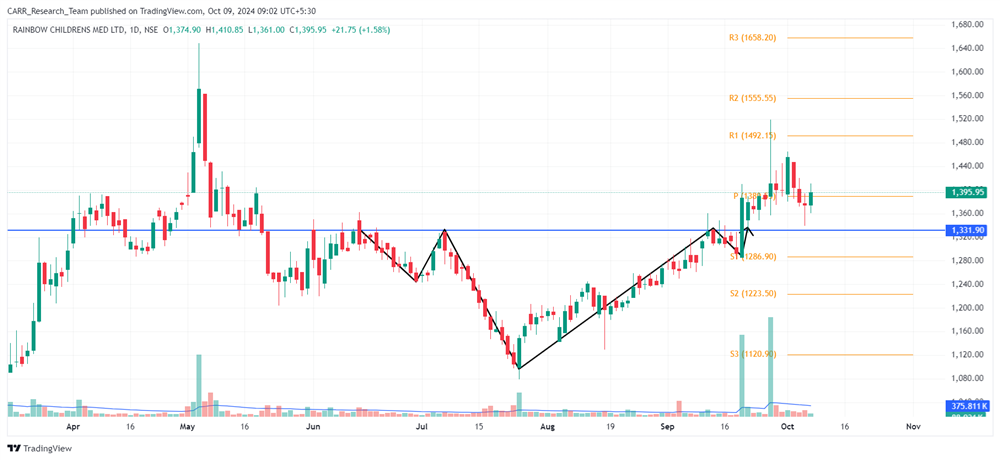
Stock name: Rainbow Childrens Medicare Ltd.

Pattern: Inverse head and shoulders pattern

Time frame: Daily

Observation:

The stock has cooled off from its all-time high since May 2024. Between June and September 2024, it formed an inverse head and shoulders pattern on the daily chart, followed by a major breakout on 19th September, supported by high trading volume. Post-breakout, the stock showed strong upward movement with occasional high-volume candles. If the momentum holds, the stock may see further gains based on technical analysis. It's advisable to look for additional confirmations, such as RSI levels and the MACD indicator.

You may add this to your watch list to understand further price action.

Disclaimer: This analysis is purely for educational purpose and does not contain any recommendation. Please consult your financial advisor before taking any financial decision.
Technical Analysis of APLAPOLLO & RAINBOW
Read More
Technical Analysis of JMFINANCIL & APTUS

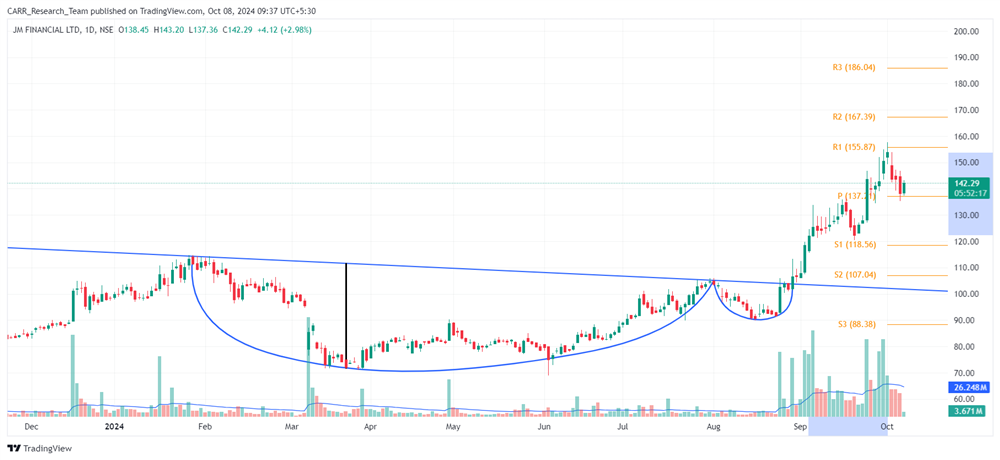
Stock name: JM Financial Ltd.

Pattern: Cup and handle pattern

Time frame: Daily

Observation:

According to the blog from September 4, 2024, the stock formed a cup and handle pattern on its daily chart, breaking out at the end of August. Post-breakout, it saw significant upward momentum supported by strong trading volumes. From September 4 to October 1, 2024, the stock surged over 25%.

You may add this to your watch list to understand further price action.

Disclaimer: This analysis is purely for educational purpose and does not contain any recommendation. Please consult your financial advisor before taking any financial decision.

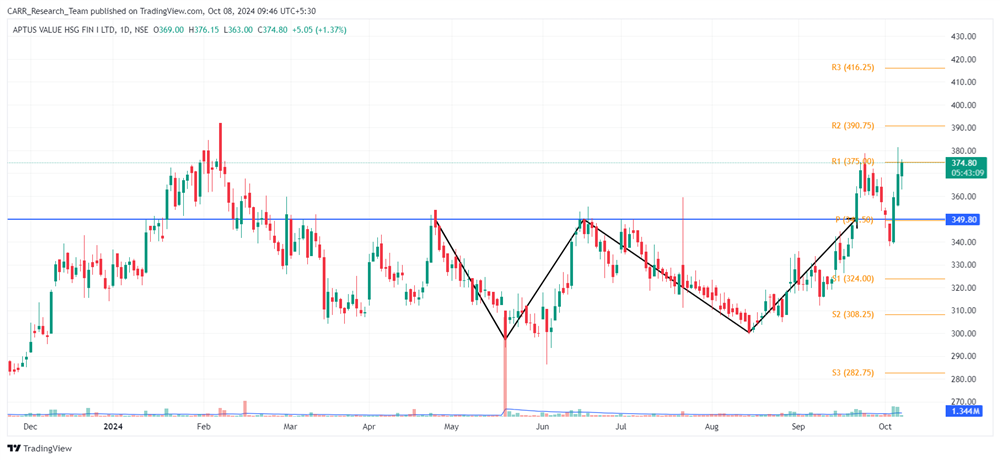
Stock name: Aptus Value Housing Finance India Ltd.

Pattern: Double bottom pattern and retest

Time frame: Daily

Observation:

As mentioned in the blog on September 26, 2024, the stock formed a double bottom pattern on its daily chart, breaking out on September 20 with strong trading volume. However, due to overall bearish market sentiment, it retraced and retested the breakout level. The stock has since rebounded with significant volume, and technical analysis suggests that if it maintains this momentum, the stock may see further upward movement. Additionally, the stock has repeatedly encountered resistance at its all-time high (ATH), making this level critical for its future performance. It's advisable to look for additional confirmations, such as RSI levels and the MACD indicator.

You may add this to your watch list to understand further price action.

Disclaimer: This analysis is purely for educational purpose and does not contain any recommendation. Please consult your financial advisor before taking any financial decision.
Technical Analysis of JMFINANCIL & APTUS
Read More
Technical Analysis of GILLETTE &  HOMEFIRST

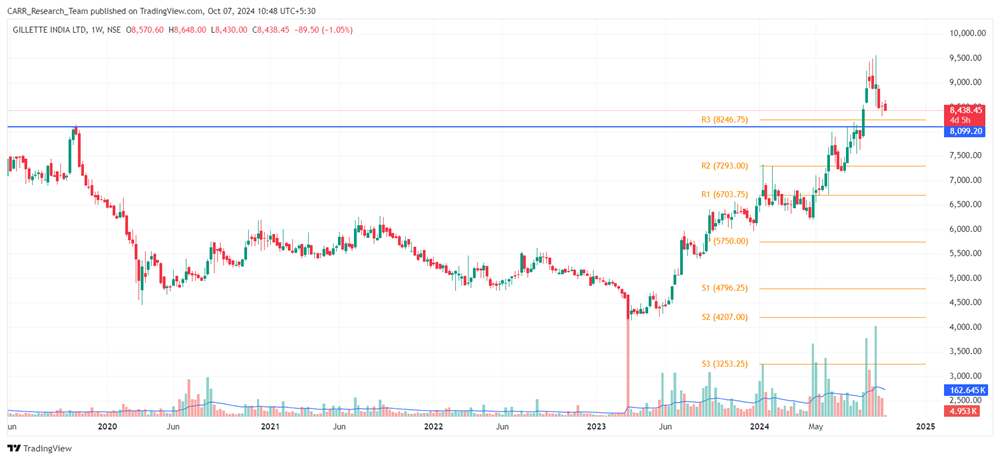
Stock name: Gillette India Ltd.

Pattern: Resistance breakout and retest

Time frame: Weekly

Observation:

The stock reached its previous all-time high (ATH) in 2019 but experienced a downward trend afterward. Recovery began in March 2023, though it encountered resistance around the 8100 level, near its previous ATH. In August 2024, the stock broke through this resistance, followed by an upward move with significant trading volume. Currently, it is undergoing a retest with lower volume, in line with overall market conditions. Technical analysis suggests that if the stock rebounds with strong momentum, the stock may see further improvement. It's advisable to look for additional confirmations, such as RSI levels and the MACD indicator.

You may add this to your watch list to understand further price action.

Disclaimer: This analysis is purely for educational purpose and does not contain any recommendation. Please consult your financial advisor before taking any financial decision.
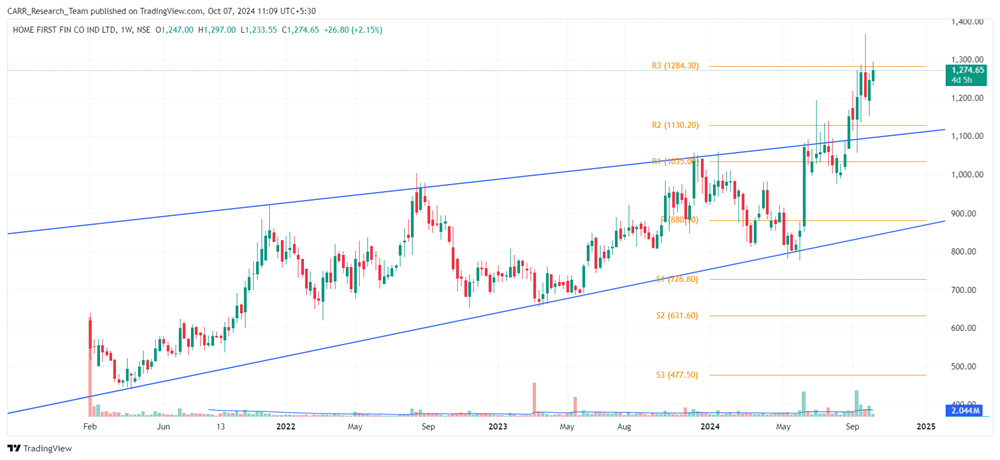
Stock name: Home First Finance Company India Ltd.

Pattern: Resistance breakout

Time frame: Weekly

Observation:

Since its listing in 2021, the stock has been trading within a parallel channel. Towards the end of August 2024, it broke out of this pattern, followed by an upward movement supported by strong trading volume. According to technical analysis, if the stock maintains its breakout momentum, it may see further rise. It's advisable to look for additional confirmations, such as RSI levels and the MACD indicator.

You may add this to your watch list to understand further price action.

Disclaimer: This analysis is purely for educational purpose and does not contain any recommendation. Please consult your financial advisor before taking any financial decision.

Technical Analysis of GILLETTE & HOMEFIRST
Read More
Impact of Israel Iran conflict on the Indian Stock Market

The frontline indices, Sensex and Nifty 50, lost about 4.5% each this week, marking their worst performance since June 2022. The bulk of the decline came from a 2% drop on Thursday. After three consecutive weeks of positive returns, the indices ended the September 30-October 4 week on a downbeat note, retreating over 5% from their record highs on September 27.

The escalating Middle East conflict, particularly between Israel and Iran, has heightened concerns over potential crude oil supply disruptions from the region, which accounts for one-third of global oil production. This has caused a sharp rise in crude oil prices, adversely affecting net importers like India. Brent crude futures surged by over 10% this week, with a 1% increase on Friday alone.

The conflict has also raised concerns about oil passing through the critical Strait of Hormuz, with fears that Israel may target Iran's major oil fields, potentially pushing prices even higher. While OPEC+'s December supply-output plan has limited the gains, Corporate India remains worried about the rising freight costs and disruptions to air shipping routes.

One-fifth of the world’s crude passes through the Strait of Hormuz. Fears are mounting that Israel could retaliate by targeting Iran's major oil fields, which would likely push oil prices even higher. The only factor limiting the gain in oil prices is the December supply-output plan by the Organisation of Petroleum Exporting Countries and its allies (OPEC+).

The spike in oil prices could impact several sectors in India, including aviation, automotive, and chemicals. ICRA warns that higher crude prices could pose risks to WPI-based inflation and, to a lesser extent, CPI inflation for FY25. Persistent increases in oil prices may also dampen GDP growth and lead to sustained higher interest rates until geopolitical tensions subside.

Impact of Israel Iran conflict on the Indian Stock Market
Read More
Technical Analysis of SYNGENE & ECLERX

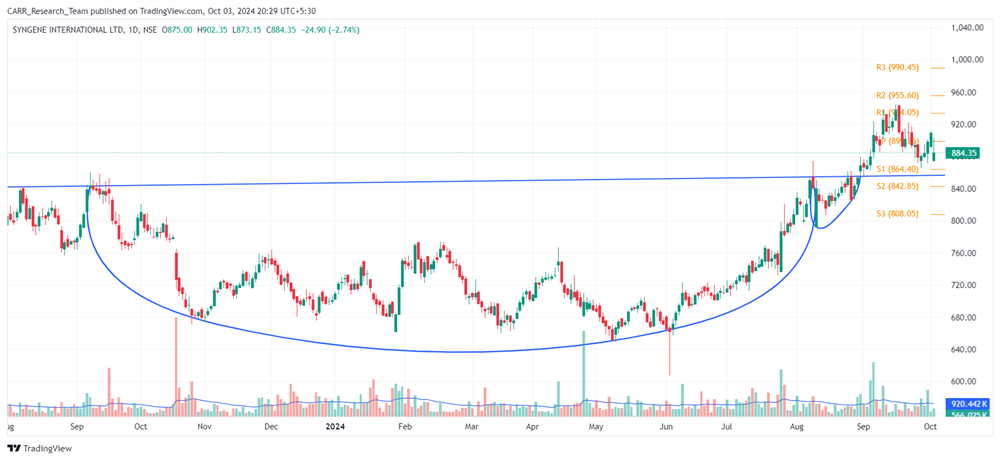
Stock name: Syngene International Ltd.

Pattern: Cup and handle pattern and retest

Time frame: Daily

Observation:

Since the post-Covid period, the stock has experienced significant upward movement. Between September 2023 and August 2024, it formed a cup and handle pattern on its daily chart, with a breakout at the end of August 2024. Following the breakout, the stock saw strong upward movement with solid volume support but later faced a retest. Currently, it appears to have rebounded above the breakout line from the retest and is moving upward again. According to technical analysis, if the stock gains strong momentum from this rebound, the stock may move in further upward direction. It's advisable to look for additional confirmations, such as RSI levels and the MACD indicator.

You may add this to your watch list to understand further price action.

Disclaimer: This analysis is purely for educational purpose and does not contain any recommendation. Please consult your financial advisor before taking any financial decision.
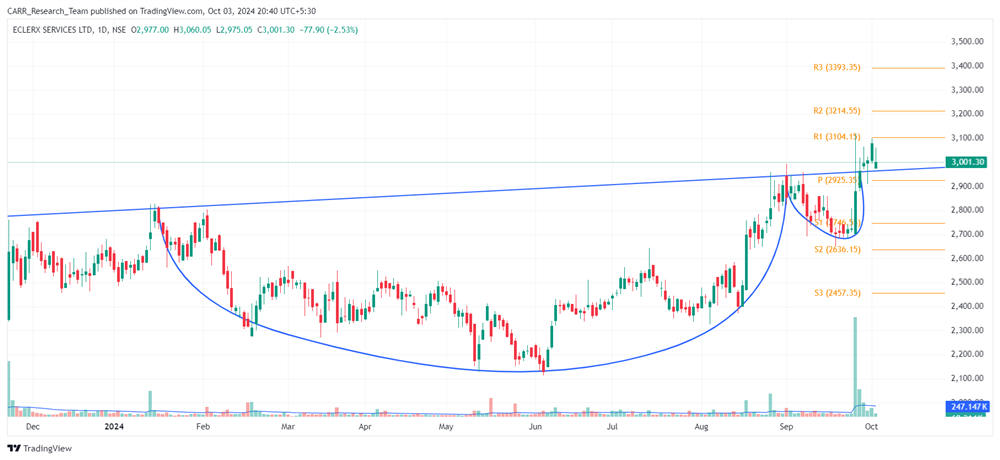
Stock name: eClerx Services Ltd.

Pattern: Cup and handle pattern

Time frame: Daily

Observation:

The stock has followed an upward trend since the post-Covid period. From January to September 2024, it formed a cup and handle pattern on its daily chart. In late September 2024, the stock experienced a strong breakout, supported by substantial volume, and has been moving upward since. According to technical analysis, if the current momentum is maintained, the stock may see further upward movement. It's advisable to look for additional confirmations, such as RSI levels and the MACD indicator.

You may add this to your watch list to understand further price action.

Disclaimer: This analysis is purely for educational purpose and does not contain any recommendation. Please consult your financial advisor before taking any financial decision.
Technical Analysis of SYNGENE & ECLERX
Read More
Technical Analysis of RADICO & AMBER

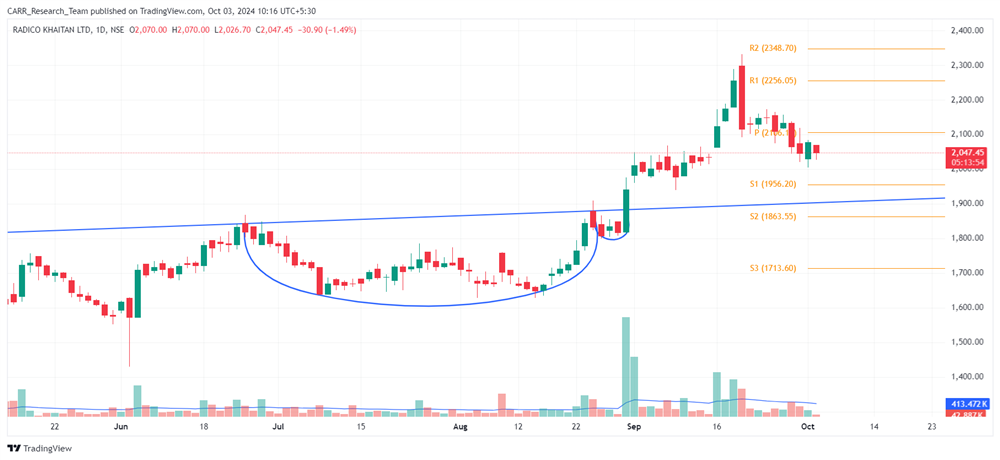
Stock name: Radico Khaitan Ltd.

Pattern: Cup and handle pattern

Time frame: Daily

Observation:

According to the blog from 4th September 2024 (link for reference), this stock formed a cup and handle pattern on its daily chart from 25th June to 30th August 2024. It broke out from the pattern on 30th August, followed by an upward movement supported by high volume. Since the breakout, the stock has risen by around 20% till 19th September 2024.

You may add this to your watch list to understand further price action.

Disclaimer: This analysis is purely for educational purpose and does not contain any recommendation. Please consult your financial advisor before taking any financial decision.

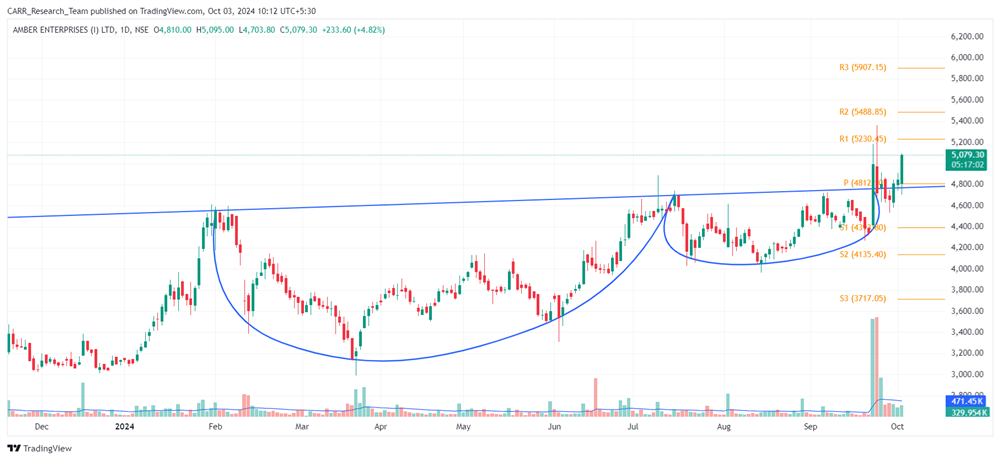
Stock name: Amber Enterprises India Ltd.

Pattern: Cup and handle pattern and retest

Time frame: Daily

Observation:

The stock formed a cup and handle pattern on its daily chart from February to September 2024, breaking out on 23rd September 2024. After the breakout, it experienced a sharp retest on the next candle but managed to rebound. However, strong volume support is still lacking to confirm upward momentum. If the stock gains momentum, technical analysis suggests that the stock may see further upward movement. It's advisable to look for additional confirmations, such as RSI levels and the MACD indicator.

You may add this to your watch list to understand further price action.

Disclaimer: This analysis is purely for educational purpose and does not contain any recommendation. Please consult your financial advisor before taking any financial decision.
Technical Analysis of RADICO & AMBER
Read More
Technical Analysis of AFFLE & LUPIN

Stock name: Affle (India) Ltd.

Pattern: Resistance breakout

Time frame: Monthly

Observation:

The stock had been seen consolidation from February 2021 onwards. This has led to movement in a parallel channel on the monthly chart. In the month of August 2024, the stock has registered a breakout from the pattern with a support of good volume. The stock was able to sustain the breakout level in the following month. According to technical analysis, if the stock can maintain upward momentum, it may experience further gains. It's advisable to look for additional confirmations, such as RSI levels and the MACD indicator.

You may add this to your watch list to understand further price action.

Disclaimer: This analysis is purely for educational purpose and does not contain any recommendation. Please consult your financial advisor before taking any financial decision.
Stock name: Lupin Ltd.

Pattern: Rounding bottom pattern

Time frame: Monthly

Observation:

The stock reached its previous all-time high in October 2015 and has been in a downward trend since. However, from 2023, it started to recover, forming a rounding bottom pattern on the monthly chart from 2015 to 2024. In August 2024, the stock broke out of this pattern, and the following candle maintained the breakout level. If it sustains this momentum, then as per technical analysis the stock may see further upward movement. It's advisable to look for additional confirmations, such as RSI levels and the MACD indicator.

You may add this to your watch list to understand further price action.

Disclaimer: This analysis is purely for educational purpose and does not contain any recommendation. Please consult your financial advisor before taking any financial decision.

Technical Analysis of AFFLE & LUPIN
Read More