Filter
RSS

Blog posts of '2024' 'November'

Technical Analysis of ANGELONE & SYRMA

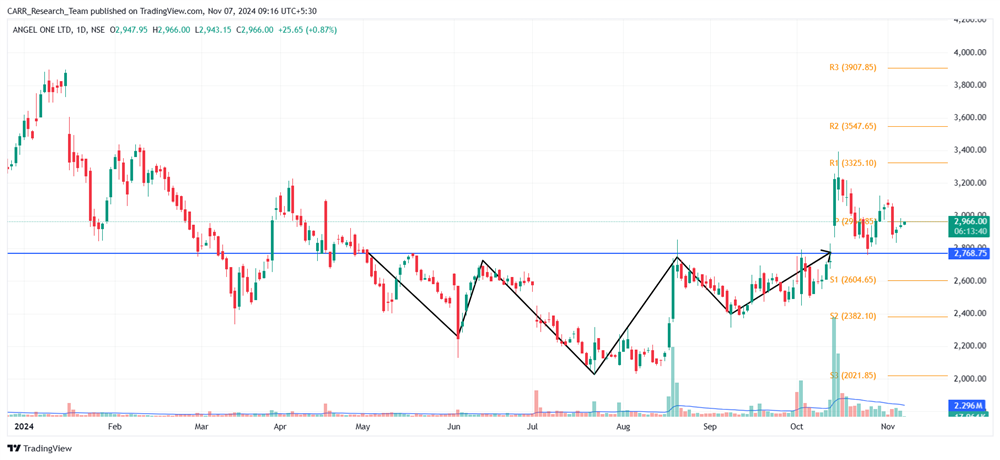
Stock name: Angel One Ltd.

Pattern: Inverse head and shoulders pattern and retest

Time frame: Daily

Observation:

Since January 2024, the stock has trended downward. The stock has formed an inverse head and shoulders pattern between May and October. It broke out of this pattern on October 15, 2024, followed by a retest phase. The stock has since rebounded from the retest and stayed above the breakout line. Technical analysis suggests that with strong upward momentum, the stock may see further gains. It's advisable to look for additional confirmations, such as RSI levels and the MACD indicator. Top of FormBottom of FormBottom of Form
You may add this to your watch list to understand further price action.

Disclaimer: This analysis is purely for educational purpose and does not contain any recommendation. Please consult your financial advisor before taking any financial decision.

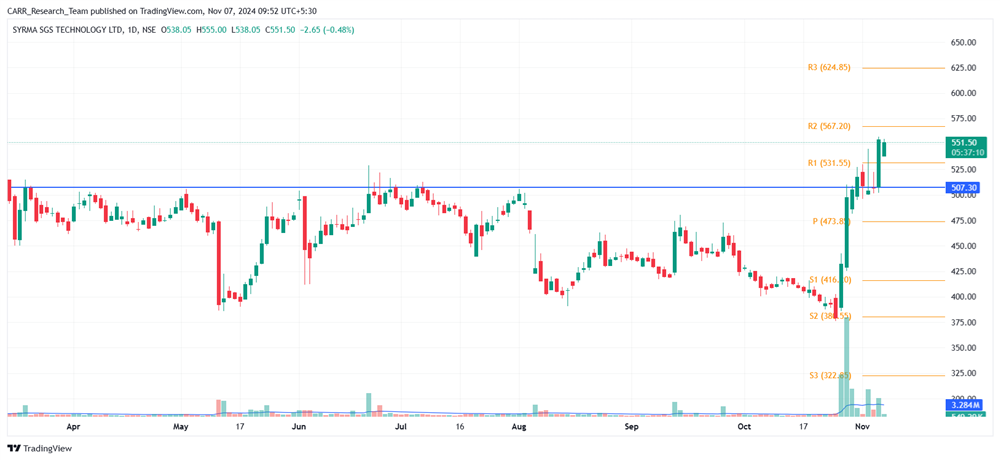
Stock name: Syrma SGS Technology Ltd.

Pattern: Resistance breakout

Time frame: Daily

Observation:

The daily chart shows a double top pattern, with a breakout level that has served as a resistance line since March 2024. The stock repeatedly approached this line without breaking through, but by late October 2024, it gained strong upward momentum and finally registered a breakout. According to technical analysis, if this momentum holds, the stock may see further upward movement. It's advisable to look for additional confirmations, such as RSI levels and the MACD indicator.
You may add this to your watch list to understand further price action.

Disclaimer: This analysis is purely for educational purpose and does not contain any recommendation. Please consult your financial advisor before taking any financial decision.

Technical Analysis of ANGELONE & SYRMA
Read More
Technical Analysis of RAINBOW and RBLBANK

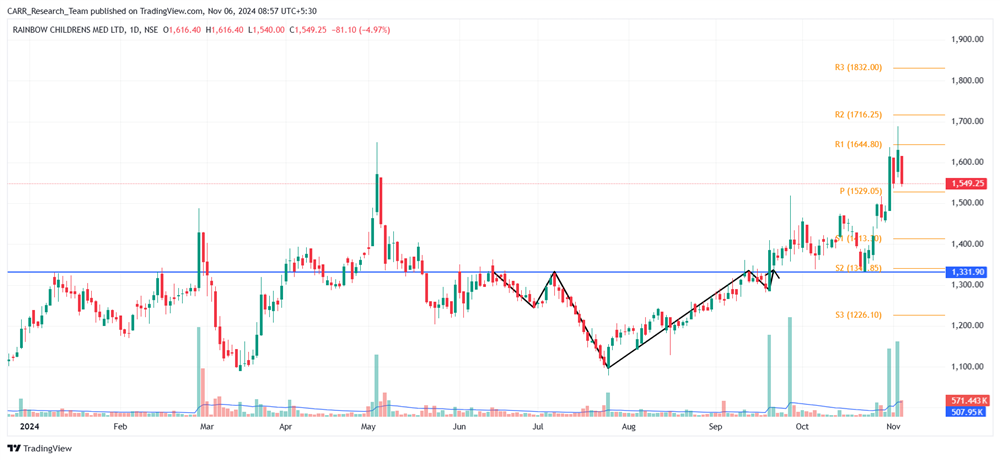
Stock name: Rainbow Childrens Medicare Ltd.

Pattern: Inverse head and shoulders pattern

Time frame: Daily

Observation:

Referring to the previous blog (link for reference), the stock formed an inverse head-and-shoulders pattern on its daily chart and broke out with strong volume on September 19, 2024. After a brief retest, it rebounded on October 23 with solid momentum, leading to a rapid upward movement. This surge helped the stock hit its technical target and reach a new all-time high (ATH). Top of FormBottom of FormBottom of Form

You may add this to your watch list to understand further price action.

Disclaimer: This analysis is purely for educational purpose and does not contain any recommendation. Please consult your financial advisor before taking any financial decision.

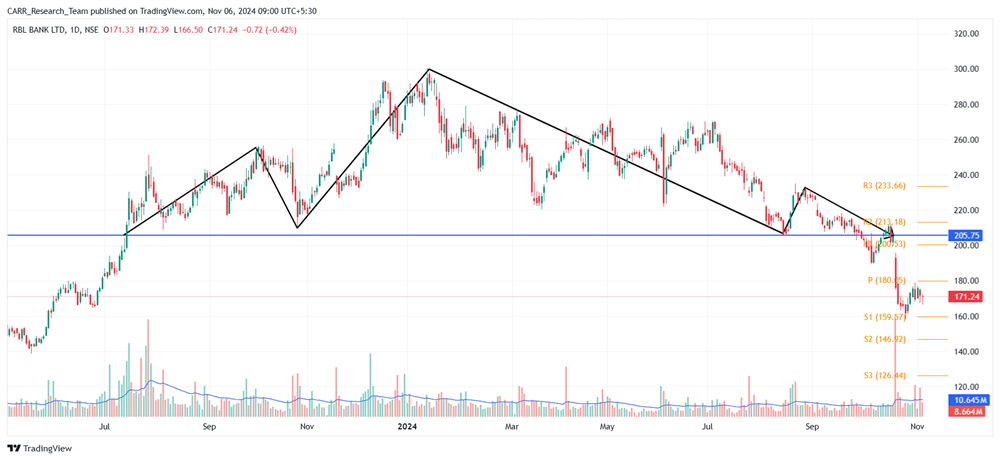
Stock name: RBL Bank Ltd.

Pattern: Head and shoulders pattern and retest

Time frame: Daily

Observation:

Since June 2022, the stock has generally trended upward. However, from July 2023 to October 2024, it formed a head-and-shoulders pattern on the daily chart and broke below the pattern in early October 2024. Following a retest, a large red candle with high volume appeared on October 21, suggesting further downward momentum. If this momentum holds, the stock may experience additional declines according to technical analysis. It's advisable to look for additional confirmations, such as RSI levels and the MACD indicator.

You may add this to your watch list to understand further price action.

Disclaimer: This analysis is purely for educational purpose and does not contain any recommendation. Please consult your financial advisor before taking any financial decision.

Technical Analysis of RAINBOW and RBLBANK
Read More
Technical Analysis of HONAUT and RTNINDIA

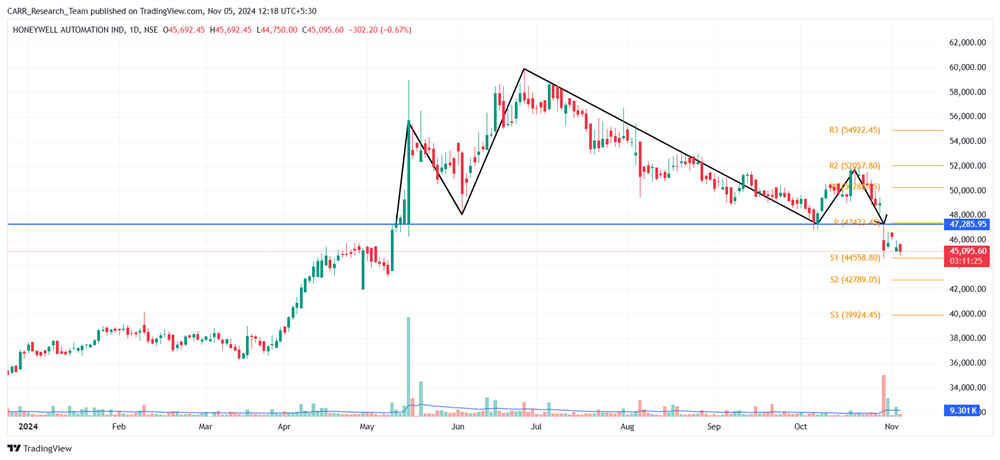
Stock name: Honeywell Automation India Ltd.

Pattern: Head and shoulders pattern

Time frame: Daily

Observation:

The stock’s overall trend has remained upward, but between May and October 2024, it formed a head and shoulders pattern on the daily chart. On October 30, 2024, it registered a breakdown from this pattern with a gap-down opening and significant trading volume. Since the breakout, the stock has closed below the breakdown line for several sessions and is now encountering some support. According to technical analysis, if the stock regains its breakdown momentum, it may face further decline. It's advisable to look for additional confirmations, such as RSI levels and the MACD indicator. Top of FormBottom of FormBottom of Form

You may add this to your watch list to understand further price action.

Disclaimer: This analysis is purely for educational purpose and does not contain any recommendation. Please consult your financial advisor before taking any financial decision.
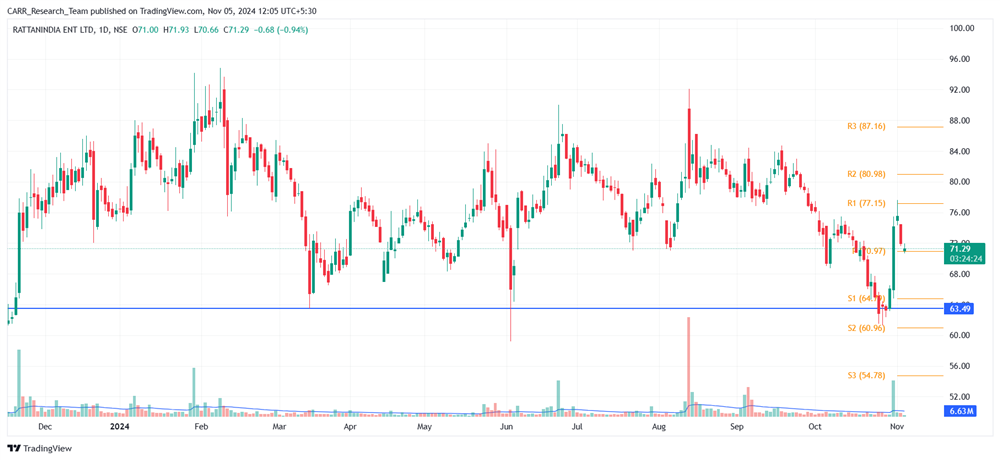
Stock name: RattanIndia Enterprises Ltd.

Pattern: Support and reversal

Time frame: Daily

Observation:

From April to July 2021, the stock experienced a strong upward trend, reaching a new all-time high. After this surge, the stock cooled off, creating a resistance level. Following several attempts, it finally broke through this resistance in November 2023, turning the resistance line into a support line. Since then, the stock has consolidated, frequently holding above this support. During the recent market correction, the stock has also seen some downward movement and rebounded towards the end of October 2024 from the support line. Technical analysis suggests that if the stock sustains this rebound momentum, further upward movement may follow. It's advisable to look for additional confirmations, such as RSI levels and the MACD indicator.

You may add this to your watch list to understand further price action.

Disclaimer: This analysis is purely for educational purpose and does not contain any recommendation. Please consult your financial advisor before taking any financial decision.
Technical Analysis of HONAUT and RTNINDIA
Read More