Filter
RSS

Blog posts of '2024' 'December'

Fed’s Hawkish Rate Cut Dampens Global Equity Markets

U.S. Federal Reserve Chair Jerome Powell’s latest policy move—a 25 basis point rate cut coupled with hawkish guidance—has dimmed prospects for a year-end "Santa rally" in global equity markets. The Dow Jones Industrial Average saw its worst day in over four months, while India’s Sensex dropped over 1,100 points, inching closer to the 79,000 mark.

Although markets had anticipated the rate cut, Powell’s cautious tone and a significantly revised dot plot have raised concerns. The Fed now projects only two rate cuts in 2025, down from four previously forecasted in September. Similarly, the outlook for 2026 has been trimmed to just two cuts. Powell emphasized that the timing and extent of future rate reductions would be data-dependent, signaling that the Fed could "be more cautious" after already lowering rates by 100 basis points this year.

Adding to market jitters, the Fed raised its inflation forecast. Personal Consumption Expenditure (PCE) inflation is now expected to hit 2.5% by the end of 2025, up from 2.1%, and core inflation is projected at 2.8%. Even by 2026, inflation is forecast to be slightly above the Fed’s 2% target, signaling persistent price pressures. This acknowledgment of inflation challenges has led to a surge in U.S. 10-year bond yields, which crossed 4.5% for the first time in six months.

Impact on Global and Indian Markets

Higher bond yields are weighing on U.S. equity markets, particularly interest-rate-sensitive sectors like real estate, utilities, and tech, which rely on lower rates to boost the present value of future earnings. Analysts warn of further declines if bond yields continue to rise, with ripple effects expected in emerging markets, including India.

India’s benchmark indices, the Sensex and Nifty, mirrored global sell-offs. The Nifty breached the critical 23,900 level, raising concerns of further declines to around 23,500. Options data indicates a bearish outlook as call sellers shift their positions closer to current prices, reflecting heightened selling pressure.

Sectoral Impact

The Fed’s hawkish stance and a stronger dollar have uneven implications for Indian sectors. Interest-rate-sensitive industries like real estate, automobiles, and capital goods may face challenges. However, export-driven sectors, particularly IT, could benefit from a stronger dollar.

Broader Economic Implications

The Fed’s hawkish pivot underscores its commitment to tackling inflation, even at the cost of slower monetary easing. The U.S. central bank revised GDP growth projections for 2024 upward to 2.5% from 2%, reflecting resilience in economic activity despite higher interest rates. This “higher-for-longer” rate strategy is expected to influence other central banks globally, including the Reserve Bank of India (RBI).

In summary, the Fed’s hawkish rate cut and cautious tone have roiled global markets, with ripple effects spreading to Indian equities. While short-term volatility looms, investors are advised to focus on fundamentally strong stocks and avoid overreacting to global market gyrations.

Fed’s Hawkish Rate Cut Dampens Global Equity Markets
Read More
Technical Analysis of SYRMA & SONACOMS

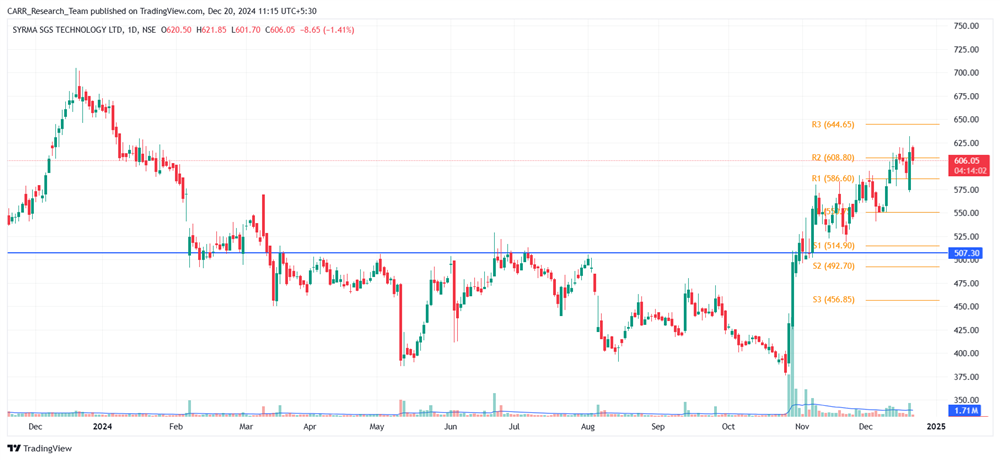
Stock name: Syrma SGS Technology Ltd.

Pattern: Resistance breakout

Time frame: Daily

Observation:

In our earlier blog on November 7, 2024 (link for reference), we highlighted the stock's breakout from the resistance line in late October 2024. Since then, the stock has sustained its momentum, showing a strong upward trajectory. Presently, it remains below its previous all-time high (ATH) but faces minimal resistance, as indicated by the chart pattern.

You may add this to your watch list to understand further price action.

Disclaimer: This analysis is purely for educational purpose and does not contain any recommendation. Please consult your financial advisor before taking any financial decision.

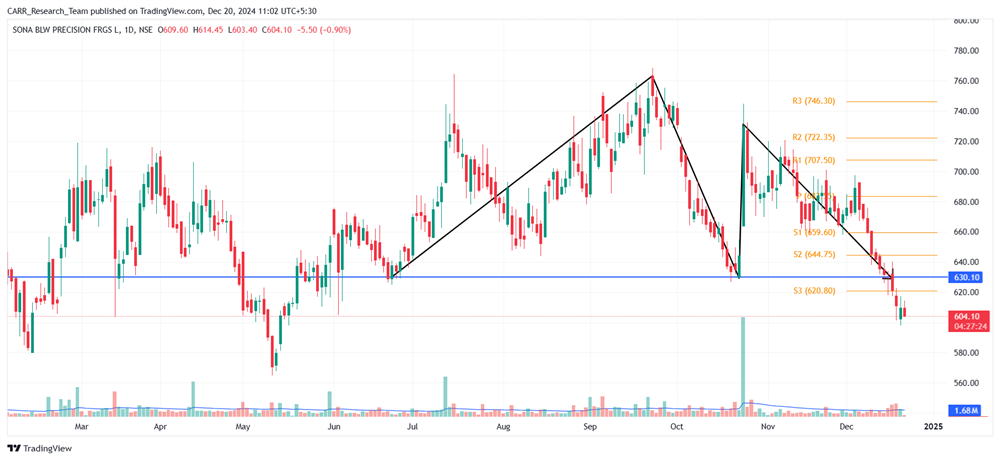
Stock name: Sona BLW Precision Forgings Ltd.

Pattern: Double top pattern

Time frame: Daily

Observation:

The stock has been in an uptrend since April 2023. Between June and December 2024, it formed a double-top pattern on the daily chart and broke down from the pattern on December 17, 2024, supported by significant trading volume. This was followed by a red candle with strong volume, signalling potential bearish pressure. If the breakout momentum persists, technical analysis suggests the stock may decline further. It's advisable to look for additional confirmations, such as RSI levels and the MACD indicator.

You may add this to your watch list to understand further price action.

Disclaimer: This analysis is purely for educational purpose and does not contain any recommendation. Please consult your financial advisor before taking any financial decision.

Technical Analysis of SYRMA & SONACOMS
Read More
Technical Analysis of SHREECEM & HUDCO

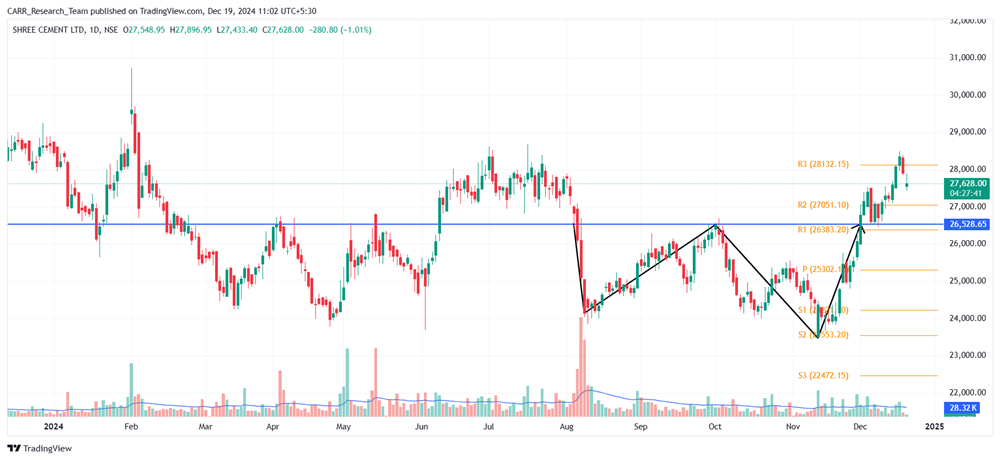
Stock name: Shree Cement Ltd.

Pattern: Double bottom pattern

Time frame: Daily

Observation:

The stock has cooled off from its high on February 1, 2024, and has declined from there onwards. Between August and December 2024, it formed a double bottom pattern on the daily chart. A breakout occurred on December 2, 2024, followed by a successful retest, after which the stock started moving upward. If the current momentum sustains, technical analysis suggests the stock may see further gains. It's advisable to look for additional confirmations, such as RSI levels and the MACD indicator.

You may add this to your watch list to understand further price action.

Disclaimer: This analysis is purely for educational purpose and does not contain any recommendation. Please consult your financial advisor before taking any financial decision.

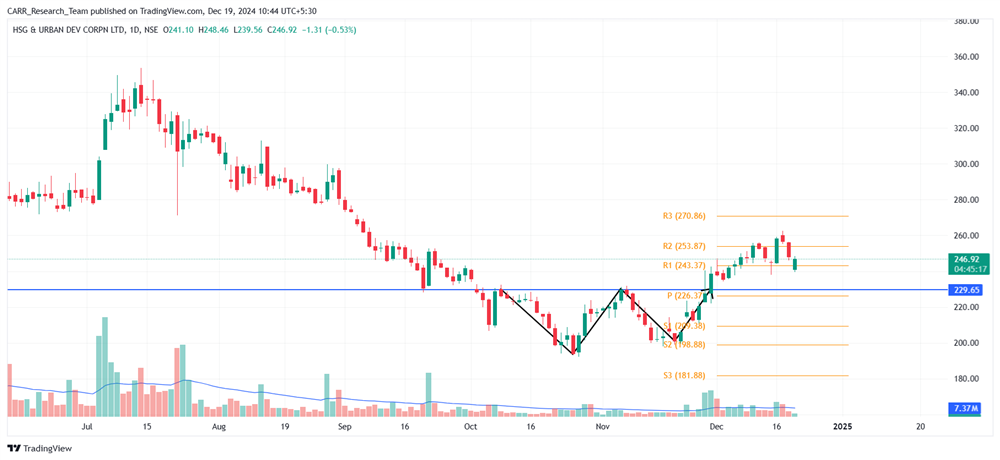
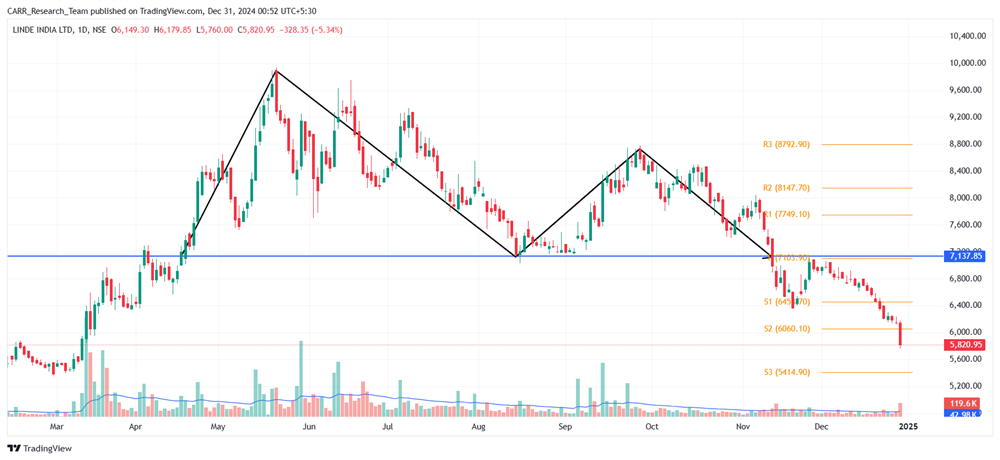
Stock name: Housing & Urban Development Corporation Ltd.

Pattern: Double bottom pattern

Time frame: Daily

Observation:

The stock reached its all-time high (ATH) on July 12, 2024, before cooling off and moved in downward direction. Between October and November 2024, it formed a double bottom pattern on the daily chart, breaking out on November 29, 2024, with significant trading volume. Since the breakout, the stock has moved upward and recently stabilized. According to technical analysis, if it regains momentum, further upside potential may be expected. It's advisable to look for additional confirmations, such as RSI levels and the MACD indicator.
You may add this to your watch list to understand further price action.

Disclaimer: This analysis is purely for educational purpose and does not contain any recommendation. Please consult your financial advisor before taking any financial decision.

Technical Analysis of SHREECEM & HUDCO
Read More
Technical Analysis of ANANTRAJ & RCF

Stock name: Anant Raj Ltd.

Pattern: Resistance breakout

Time frame: Daily

Observation:

Since its listing, the stock has been in an upward trend, reaching its all-time high on October 16, 2024. After stabilizing, it formed a resistance line near this level on the daily chart. On December 16, 2024, the stock broke out above its previous ATH, confirmed by a strong green candle with significant volume on December 17. Currently trading in its highest zone, technical analysis suggests the uptrend may continue if the momentum persists. It's advisable to look for additional confirmations, such as RSI levels and the MACD indicator.

You may add this to your watch list to understand further price action.

Disclaimer: This analysis is purely for educational purpose and does not contain any recommendation. Please consult your financial advisor before taking any financial decision.

Stock name: Rashtriya Chemicals & Fertilizers Ltd.

Pattern: Double bottom pattern

Time frame: Daily

Observation:

The stock reached its all-time high in July 2024 but cooled off afterward, mirroring the broader market's downward movement. Between October and November 2024, it formed a double bottom pattern on the daily chart, breaking out on November 28. Following a minor uptick, the stock stabilized above the breakout level. On December 17, it experienced significant upward movement with high volume but is currently facing resistance. As per technical analysis, a breakout from the resistance level may lead to further gains. It's advisable to look for additional confirmations, such as RSI levels and the MACD indicator.

You may add this to your watch list to understand further price action.

Disclaimer: This analysis is purely for educational purpose and does not contain any recommendation. Please consult your financial advisor before taking any financial decision.


Technical Analysis of ANANTRAJ & RCF
Read More
Technical Analysis of RATNAMANI & IRCON

Stock name: Ratnamani Metals & Tubes Ltd.

Pattern: Head and shoulders pattern

Time frame: Daily

Observation:

The stock experienced a strong upward movement starting in March 2024. However, between June and November 2024, it formed a head and shoulders pattern on the daily chart, followed by a significant breakdown in late November 2024. This was further confirmed by continued red candles with high volumes on December 4 and December 12, 2024. According to technical analysis, if the stock sustains the breakdown momentum, it may see further downside. It's advisable to look for additional confirmations, such as RSI levels and the MACD indicator.

You may add this to your watch list to understand further price action.

Disclaimer: This analysis is purely for educational purpose and does not contain any recommendation. Please consult your financial advisor before taking any financial decision.

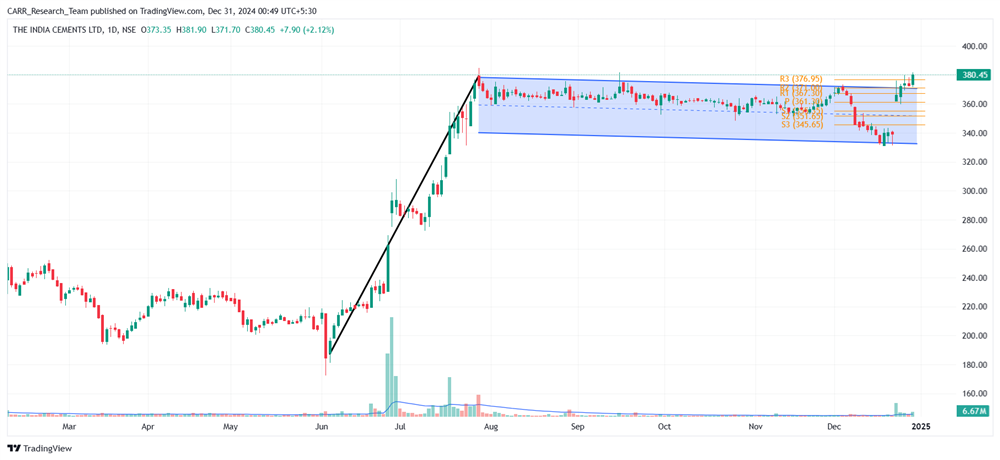
Stock name: IRCON International Ltd.

Pattern: Double bottom pattern

Time frame: Daily

Observation:

The stock reached its all-time high (ATH) on July 15, 2024, before cooling off. From October 2024 to December 2024, it formed a double bottom pattern on the daily chart, breaking out of the pattern on December 6, 2024. This breakout was confirmed by a significant green candle with strong volumes on December 11, 2024. Currently the stock is holding the breakout level. According to technical analysis, the stock may rise further if it sustains its momentum. It's advisable to look for additional confirmations, such as RSI levels and the MACD indicator.
You may add this to your watch list to understand further price action.

Disclaimer: This analysis is purely for educational purpose and does not contain any recommendation. Please consult your financial advisor before taking any financial decision.

Technical Analysis of RATNAMANI & IRCON
Read More
Technical Analysis of GRINDWELL & HDFCBANK

Stock name: Grindwell Norton Ltd.

Pattern: Support and reversal

Time frame: Weekly

Observation:

The stock has maintained an overall uptrend, forming an inclined support line on the weekly chart from August 2021 to December 2024. It has repeatedly rebounded from this support, most recently in late November 2024, after cooling off from its ATH since July 2024. This rebound, supported by strong trading volume, has led to an upward movement. According to technical analysis, if the current momentum sustains, the stock may witness further upward progress. It's advisable to look for additional confirmations, such as RSI levels and the MACD indicator.

You may add this to your watch list to understand further price action.

Disclaimer: This analysis is purely for educational purpose and does not contain any recommendation. Please consult your financial advisor before taking any financial decision

Stock name: HDFC Bank Ltd.

Pattern: Resistance breakout

Time frame: Weekly

Observation:

Post-COVID, the stock saw a swift recovery, reaching its peak by October 2021. Since then, it has traded sideways, forming a resistance near its ATH, with multiple unsuccessful breakout attempts. Even though the stock has breached the highs of October 2021 there was no significant upward movement. However, in late November 2024, the stock finally broke out of this pattern with strong volumes, marking a decisive upward move. Currently at its highest price, technical analysis suggests that sustained momentum could lead to further gains. It's advisable to look for additional confirmations, such as RSI levels and the MACD indicator.

You may add this to your watch list to understand further price action.

Disclaimer: This analysis is purely for educational purpose and does not contain any recommendation. Please consult your financial advisor before taking any financial decision.

Technical Analysis of GRINDWELL & HDFCBANK
Read More
Switzerland’s MFN Withdrawal: Implications for Indian Firms and Global Taxation Policies

Switzerland’s withdrawal of the Most Favoured Nation (MFN) clause from its Double Taxation Avoidance Agreement (DTAA) with India will increase costs for Indian firms operating in Switzerland, particularly in financial services, pharmaceuticals, and IT. Effective January 1, 2025, these firms will face a 10% tax on dividends and other incomes, up from the previous 5% rate. According to the Global Trade Research Initiative (GTRI), this higher tax liability will reduce the competitiveness of Indian businesses compared to firms from countries still enjoying MFN benefits.

Switzerland’s decision stems from a recent Indian Supreme Court ruling in the Nestlé case (October 2023), which clarified India’s stance on the MFN clause. The court ruled that MFN benefits cannot be automatically applied to the India-Switzerland treaty unless explicitly notified under Section 90 of the Indian Income Tax Act. The judgment also limited the MFN clause to OECD member countries as of 1994, when the treaty was signed, excluding nations like Colombia and Lithuania, which joined the OECD later.

Switzerland disagreed with India’s interpretation for two key reasons. First, Switzerland believed the MFN clause should automatically apply, allowing India to benefit from reduced tax rates extended to newer OECD members like Colombia, which joined in 2020. Based on this understanding, Switzerland had unilaterally reduced the residual tax rate on dividends to 5%. Second, Switzerland argued that subsequent OECD members should qualify for MFN benefits, contrary to India’s position. These differences led Switzerland to suspend the MFN clause and revert to the higher 10% tax rate.

GTRI noted that Switzerland’s decision could have broader implications for India’s approach to MFN clauses in bilateral treaties. The Supreme Court’s ruling sets a precedent that may influence similar agreements with other trading partners. If such disputes persist, Indian businesses could face higher tax burdens and compliance challenges in other jurisdictions, potentially discouraging outbound investments.

India has previously faced issues with its DTAAs, particularly with Australia. Indian software firms have long disputed Australia’s classification of payments for software licenses and services as royalties, which are subject to source taxation. Indian firms argue these payments should be treated as business income, taxable only in India unless they have a permanent establishment in Australia. This mismatch in interpretations leads to double taxation risks and compliance challenges, compounded by Australia’s reliance on domestic laws that may override treaty provisions.

The GTRI emphasizes the need for India to adopt a consistent and strategic approach to international taxation treaties. The suspension of the MFN clause by Switzerland and the ongoing issues with Australia highlight gaps in India’s DTAA frameworks. GTRI recommends that India modernize its treaty provisions to reflect contemporary business realities, particularly in the digital and service sectors. A more proactive and cohesive approach is essential to reduce tax uncertainties, enhance global competitiveness, and safeguard outbound investments by Indian businesses.


Switzerland’s MFN Withdrawal: Implications for Indian Firms and Global Taxation Policies
Read More
Technical Analysis of 360ONE & TITAGARH

Stock name: 360 ONE WAM Ltd.

Pattern: Resistance breakout

Time frame: Daily

Observation:

The stock has been on an upward trajectory since its listing, reaching its all-time high on August 1, 2024. Since then, it has consolidated, forming a resistance line near the body of the ATH candle. Between August and December 2024, the stock repeatedly attempted to break this resistance but closed below it each time. After a failed breakout on December 2, the stock achieved a decisive breakout on December 9, followed by a continuation candle on December 10 with strong trading volume. Currently, the stock is holding above the breakout level, and technical analysis suggests it may rise further if the momentum sustains. It's advisable to look for additional confirmations, such as RSI levels and the MACD indicator.

You may add this to your watch list to understand further price action.

Disclaimer: This analysis is purely for educational purpose and does not contain any recommendation. Please consult your financial advisor before taking any financial decision.

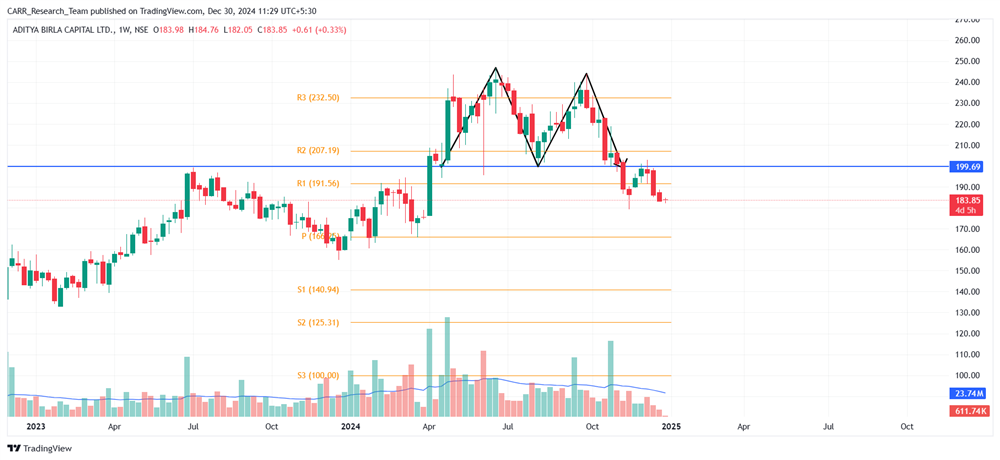
Stock name: Titagarh Rail Systems Ltd.

Pattern: Double bottom pattern

Time frame: Daily

Observation:

The stock reached its all-time high in June 2024, followed by a cooling-off period and a downward movement. Between September and December 2024, it formed a double bottom pattern on the daily chart, breaking out on December 11 with significant trading volume. The stock sustained the breakout level in the following session. According to technical analysis, maintaining this momentum may lead to rapid upward movement. It's advisable to look for additional confirmations, such as RSI levels and the MACD indicator.


You may add this to your watch list to understand further price action.

Disclaimer: This analysis is purely for educational purpose and does not contain any recommendation. Please consult your financial advisor before taking any financial decision.
Technical Analysis of 360ONE & TITAGARH
Read More
Technical Analysis of MINDACORP & MINDACORP

Stock name: Minda Corporation Ltd.

Pattern: Double bottom pattern

Time frame: Daily

Observation:

After reaching its ATH in August 2024, the stock experienced a cooling-off period. Between October and December 2024, it formed a double bottom pattern on the daily chart and registered a breakout on December 10, 2024, supported by strong trading volume. The breakout was sustained in the following candle. According to technical analysis, if the stock maintains this momentum, the stock may see further price appreciation. It's advisable to look for additional confirmations, such as RSI levels and the MACD indicator.

You may add this to your watch list to understand further price action.

Disclaimer: This analysis is purely for educational purpose and does not contain any recommendation. Please consult your financial advisor before taking any financial decision.
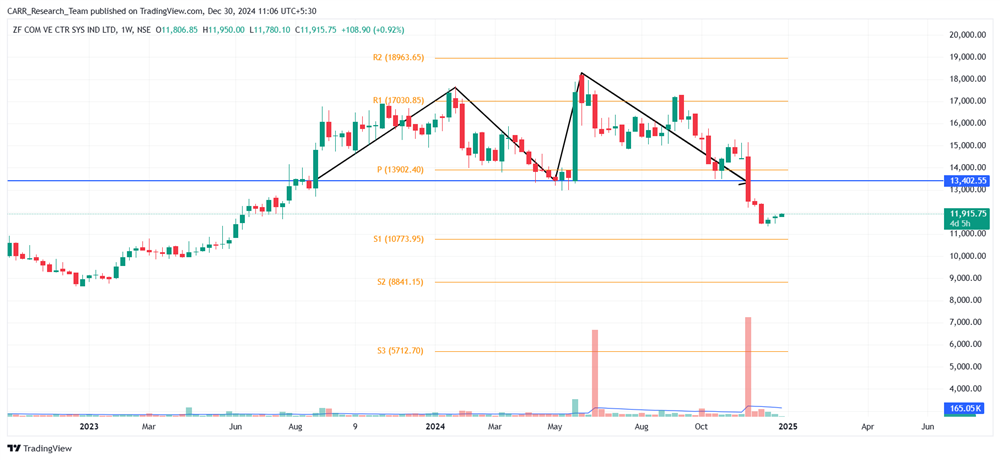
Stock name: Chalet Hotels Ltd.

Pattern: Ascending triangle pattern

Time frame: Daily

Observation:

The stock reached its previous all-time high (ATH) on March 28, 2024, and formed a resistance line around that level. Despite an overall upward trend, it struggled to break through this resistance. Between December 2023 and December 2024, the stock formed an ascending triangle pattern on the daily chart and achieved a decisive breakout on December 9, 2024, supported by high volume. As per technical analysis, if the stock sustains this momentum it may rise further. It's advisable to look for additional confirmations, such as RSI levels and the MACD indicator.

You may add this to your watch list to understand further price action.

Disclaimer: This analysis is purely for educational purpose and does not contain any recommendation. Please consult your financial advisor before taking any financial decision.

Technical Analysis of MINDACORP & MINDACORP
Read More