Filter
RSS

Blog posts of '2024' 'May'

What is Annual Information statement (AIS)?

The govt. keeps on making active efforts to improve the reporting of Income details of the citizens of the country. In this regard, the govt. has brought in certain mechanisms like Tax Deducted at source (TDS) & Tax Collected at source (TCS), Statement of Financial transactions (SFT) etc. The details gathered from all these sources are displayed in the Annual Information Statement (AIS). It is a comprehensive view of information for a taxpayer.

The information shown on AIS is divided in two parts:

PART A- General Information

Part - A displays general information pertaining to you, including PAN, Masked Aadhar Number, Name of the Taxpayer, Date of Birth/ Incorporation/ Formation, mobile number, e-mail address and address of Taxpayer.

PART- B

  • TDS/TCS Information: - Information related to tax deducted/collected at source is displayed here. The information code of the TDS/TCS, Information description and Information value is shown.
  • SFT Information: - Under this head, information received from reporting entities under Statement of Financial transaction (SFT) is displayed. The SFT code, Information description and Information value is made available.
  • Payment of Taxes: - Information relating to payment of taxes under different heads, such as Advance Tax and Self-Assessment Tax, is shown.
  • Demand and Refund: -You will be able to view the details of the demand raised and refund initiated (AY and amount) during a financial year.
  • Other Information: - Details of the information received from the other sources, such as data pertaining to Annexure II salary, Interest on refund, Outward Foreign Remittance/Purchase of Foreign Currency etc., is displayed here.


Now, out of the above information, you would know how the govt. will come to know about your salary details, since TDS was withheld from it, this is known to govt.

But, if you look carefully in your AIS, there are so many different transactions reported like your Income from Savings Bank interest, Sale of Shares / Mutual funds etc. how does this data reach the govt.?

So, this happens because of SFT reporting, SFT reporting is basically means that the govt. has mandated certain entities to report certain data in a certain format which can be used by the govt.

So, next question which pops up your mind is who does this reporting and which transactions get reported?

SI. No

Nature of transaction to be reported

Monetary threshold of transaction

Specified person required to submit SFT

1

Cash payment purchase of bank drafts or pay orders or banker’s cheque,

Aggregating to Rs.10 lakh or more in an FY

A banking company or co-operative bank to which the banking regulation applies.

Cash payments for the purchase of pre-paid instruments issued by the Reserve Bank of India,

Aggregating to Rs.10 lakh or more during the FY, 

Cash deposits or withdrawals from one or more current accounts of a person

Aggregating to Rs.50 lakh or more in an FY

2

Cash deposits in one or more accounts other than a current account and time deposit of a person

Aggregating to Rs.10 lakh or more in an FY

A banking company or co-operative bank to which the banking regulation applies,

Post-Master General of a post office

3

One or more-time deposits (other than renewed time deposit of another time deposit) of a person

Aggregating to Rs.10 lakh or more in an FY

A banking company or co-operative bank to which the banking regulation applies,

Post-Master General of a post office, 

Nidhi Company as per Section 406 of the Companies Act, 2013,

 NBFC – Non-banking financial company holding a certificate of registration under RBI Act to hold or accept deposit from public

4

Credit card payments made by any person either in cash or by any other mode in a FY.

Aggregating to Rs.1 lakh or more in cash OR

A banking company or Co-operative bank to which Banking Regulation applies or any other company or institution issuing credit card

 Rs.10 lakh or more by any other mode in an FY

5

Receipt from any person for acquiring bonds or debentures issued by the company or institution (other than renewal)

Aggregating to Rs.10 lakh or more in an FY

A company or institution issuing bonds or debentures.

6

Receipt from any person for acquiring shares (including share application money) issued by the company

Aggregating to Rs.10 lakh  or more in an FY

A company issuing shares

7

Buyback of shares from any person (other than the shares bought in the open market)

Aggregating to Rs.10 lakh  or more in an FY

Listed company purchasing its own securities under Section 68 of the Companies Act, 2013

8

Receipt from any person for acquiring units of one or more schemes of a mutual fund (other than transfer from one scheme to another)

Aggregating to Rs.10 lakh or more in an FY

A trustee of a mutual fund or any such other person authorised to manage the affairs of the mutual fund

9

Receipt from any person for sale of foreign currency including any credit of such currency to a foreign exchange card or expense in such currency through a debit or credit card or through the issue of travellers cheque or draft or any other instrument

Aggregating to Rs.10 lakh or more during an FY

Authorised person as referred to in Section 2(c) of the Foreign Exchange Management Act, 1999

10

Purchase or sale of immovable property

Transaction value or valuation of stamp duty authority referred in Section 50C for an amount of Rs.30 lakh or more.

Inspector-General appointed under Section 3 of the Registration Act, 1908 or Registrar or Sub-Registrar appointed under section 6 of that Act.

11

Cash receipt for sale, by any person, of goods or services of any nature (other than those specified at Sl. Nos. 1 to 10)

Exceeding Rs.2 lakh

Any person who is liable for audit under section 44AB of the Act


So, if you have done any of the above transactions, it is reported to the govt. and the same will be appearing in your AIS.

Hope, you are enjoying this tax series!


What is Annual Information statement (AIS)?
Read More
Technical Analysis of GODREJCP & PPLPHARMA

Stock name: Godrej Consumer Products Ltd.

Pattern: Cup and handle pattern and retest

Time frame: Weekly

Observation:

The stock's overall trend has been positive, forming a cup and handle pattern on its weekly chart from August 2021 to May 2024. It broke out of this pattern in May 2024, supported by high trading volume and a bullish MACD indicator. The stock is currently retesting this breakout, but RSI levels remain favourable. According to technical analysis, if the stock rebounds from this retest, it might continue to rise.

You may add this to your watch list to understand further price action.

Disclaimer: This analysis is purely for educational purpose and does not contain any recommendation. Please consult your financial advisor before taking any financial decision.

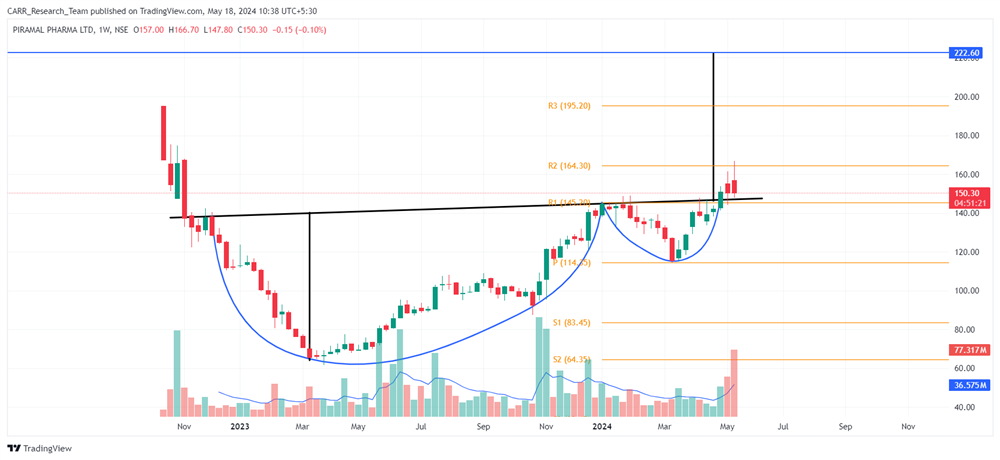
Stock name: Piramal Pharma Ltd.

Pattern: Cup and handle pattern and retest

Time frame: Weekly

Observation:

Since its listing, the stock has trended downward but later consolidated into a cup and handle pattern on its weekly chart. Towards the end of April 2024, it broke out of this pattern with above-average trading volume and a bullish MACD indicator. Currently, the stock is retesting this breakout, but the RSI level remains favourable. According to technical analysis, if the stock rebounds from this retest, it may continue to move upwards.

You may add this to your watch list to understand further price action.

Disclaimer: This analysis is purely for educational purpose and does not contain any recommendation. Please consult your financial advisor before taking any financial decision.


News for the day:

  • Nestle India shareholders have rejected the proposal to increase royalty payments to the Swiss parent company, Nestle SA. The resolution, which aimed to raise the royalty by 0.15% of sales annually over five years, failed to pass. In a stock exchange filing on Friday, Nestle India reported that 57% of shareholders voted against the plan. This decision reflects significant shareholder opposition to the proposed increase in royalty payouts.

  • The Reserve Bank of India has approved Pradeep Natarajan's appointment as Whole Time Director on the Board of IDFC FIRST Bank for three years. This appointment is pending shareholder approval. IDFC FIRST Bank reported a net profit of Rs 724 crore for Q4 March 2024, along with reductions in gross and net Non-Performing Assets to 1.88% and 0.60%, respectively. The bank will complete the necessary formalities for Natarajan's appointment.

  • Adani Energy Solutions, through its wholly owned subsidiary Adani Transmission Step Two Ltd (ATSTL), has acquired Essar Transco for ₹1,900 crore. With this acquisition, Essar Transco becomes a wholly owned subsidiary of ATSTL and a step-down subsidiary of Adani Energy. This move aligns with Adani Energy's growth strategy, expanding its network to 21,182 ckt km, including 18,109 ckt km operational and 3,073 ckt km under execution. The acquisition is expected to optimize operation and maintenance costs and enhance resource sharing.
Technical Analysis of GODREJCP & PPLPHARMA
Read More
Technical Analysis  of DRREDDY  & JUBLINGREA

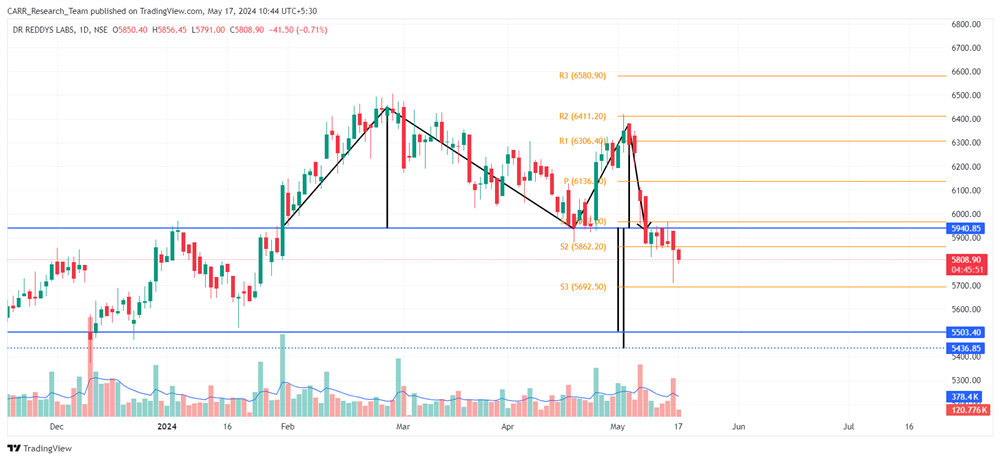
Stock name: Dr. Reddy's Laboratories Ltd.

Pattern: Double top pattern

Time frame: Daily

Observation:

The stock's overall trend has been positive, but it recently consolidated, forming a double top pattern on its daily chart. It broke out from this pattern on May 09, 2024, accompanied by a bearish MACD signal. Since the breakout, the stock has been trending downward with a low RSI. According to technical analysis, if the current momentum continues, the stock may decline further.

You may add this to your watch list to understand further price action.

Disclaimer: This analysis is purely for educational purpose and does not contain any recommendation. Please consult your financial advisor before taking any financial decision.

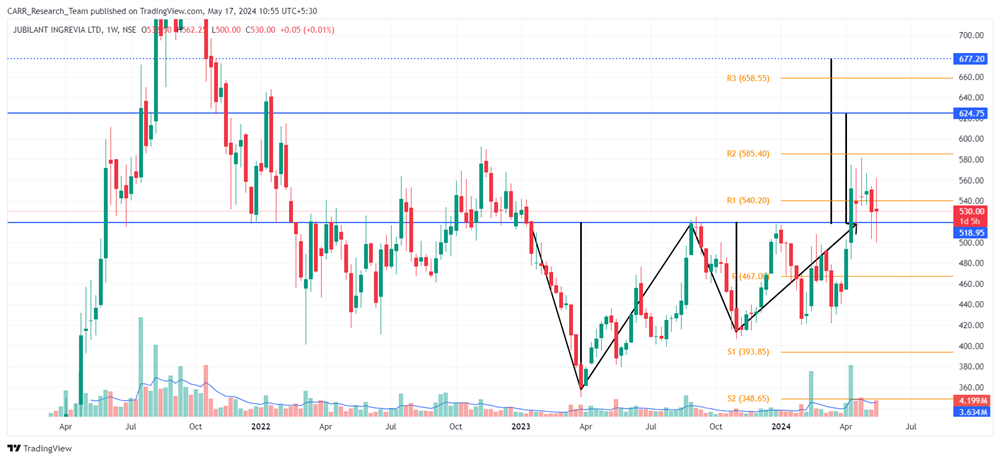
Stock name: Jubilant Ingrevia Ltd.

Pattern: Double bottom pattern and retest

Time frame: Weekly

Observation:

The stock experienced a decline from October 2021, but stabilized between January 2023 and April 2024, forming a double bottom pattern. In April 2024, it broke out from this pattern with strong trading volume and a bullish MACD indicator. The stock is currently retesting the breakout level, with the RSI in a favourable zone. According to technical analysis, a successful rebound from this retest may lead to further upward movement.

You may add this to your watch list to understand further price action.

Disclaimer: This analysis is purely for educational purpose and does not contain any recommendation. Please consult your financial advisor before taking any financial decision.


News for the day:

  • Mahindra Group plans to invest Rs 37,000 crore in its auto sector by 2030, with the aim to launch 23 new vehicles. The focus will be on electric vehicles (EVs), with significant investments in EV technology and infrastructure. Mahindra aims to have 20-30% of its SUV portfolio electric by 2030 and has already unveiled five electric SUV models. This investment aligns with their strategy to lead the SUV market and advance in EV technology, ensuring a robust growth trajectory in the coming years.

  • Dixon Technologies has partnered with Realme to manufacture display modules for mobile phones. This move marks Dixon's expansion into the high-growth display manufacturing segment, further strengthening its position in the electronics manufacturing services (EMS) market. The company plans to leverage its existing infrastructure and expertise to meet Realme's demand, which is expected to enhance both production capabilities and business growth. This partnership is a strategic step for Dixon as it aligns with its goal of broadening its portfolio and entering new high-potential sectors.

  • The NCLT has approved the merger between Reliance's Viacom18 and Disney's Star India, creating a joint venture valued at $8.5 billion. This merger aims to combine their digital and TV assets, enhancing their market reach to over 750 million viewers in India. Nita Ambani will chair the venture, with Uday Shankar as Vice Chairperson, focusing on delivering diverse and affordable content​.
Technical Analysis of DRREDDY & JUBLINGREA
Read More
Technical Analysis of BANKINDIA & CHAMBLFERT

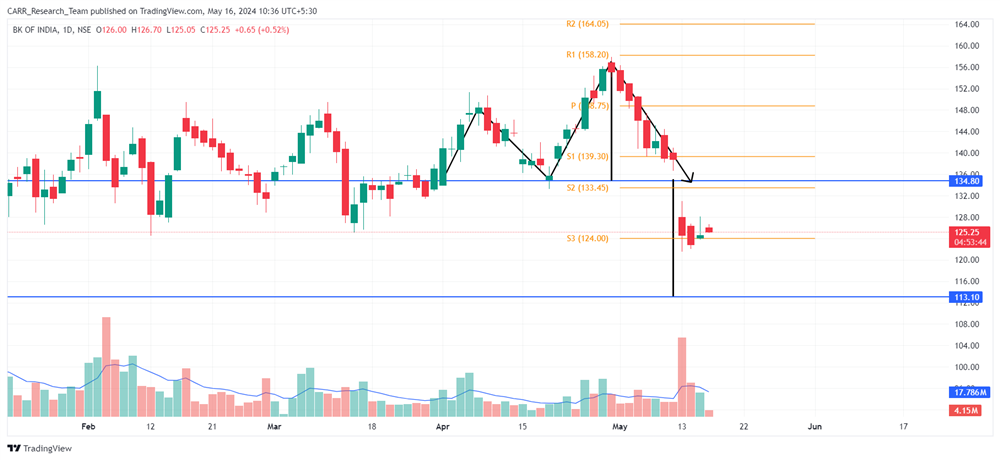
Stock name: Bank of India

Pattern: Double top pattern

Time frame: Daily

Observation:

The stock has maintained an upward trajectory for an extended period. Recently, it stabilized and exhibited a double top formation on its daily chart between April and May 2024. A breakout from this pattern occurred on May 13, 2024, backed by substantial trading volume. Following the breakout, the stock has remained below the breakout line, accompanied by low levels of RSI. Technical analysis suggests that if the current momentum persists, the stock may continue its downward movement.

You may add this to your watch list to understand further price action.

Disclaimer: This analysis is purely for educational purpose and does not contain any recommendation. Please consult your financial advisor before taking any financial decision.

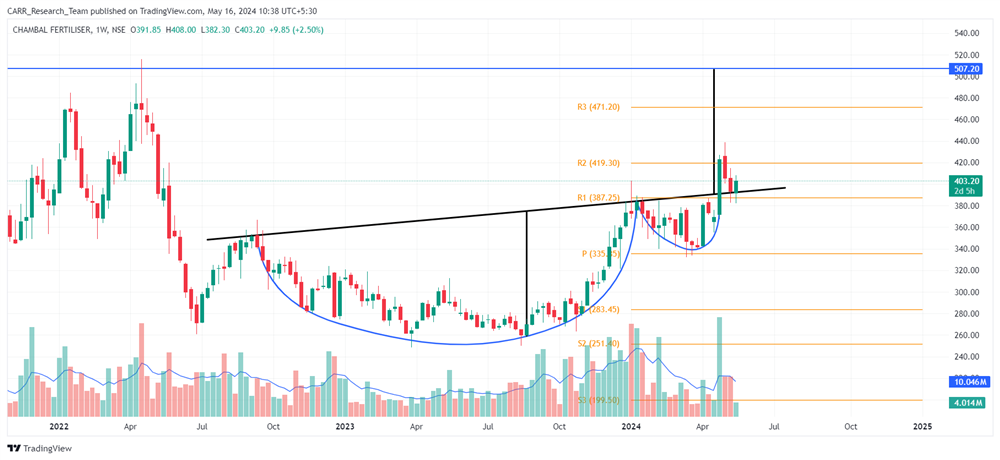
Stock name: Chambal Fertilizers & Chemicals Ltd.

Pattern: Cup and handle pattern and retest

Time frame: Weekly

Observation:

During the period spanning September 2022 to April 2024, the stock displayed a cup and handle formation on its weekly chart. In April 2024, the stock experienced a significant breakout from this pattern, accompanied by substantial trading volume and a bullish MACD indicator. Following the breakout, the stock retraced to test the breakout level and subsequently rebounded. Presently, the Relative Strength Index (RSI) indicates a favourable position. According to technical analysis, maintaining the current momentum may propel the stock further upward.

You may add this to your watch list to understand further price action.

Disclaimer: This analysis is purely for educational purpose and does not contain any recommendation. Please consult your financial advisor before taking any financial decision.


News for the day:

  • TVS Motor Co debuts in Italy via TVS Motor Italia, led by Giovanni Notarbartolo di Furnari, offering a range of conventional and electric scooters and motorcycles. The move underscores TVS's global ambitions, introducing products like the TVS Apache 310 Series, Ronin 250, Raider, NTorq, Jupiter 125, iQube, and X, alongside e-bikes from Cilo, EGO Movement, Simpel, and EBCO, reflecting confidence in the Italian market.

  • Power Finance Corporation (PFC), India's leading power sector lender, assures no impact on profitability from Reserve Bank of India's draft guidelines on infrastructure project financing. With robust capital adequacy, PFC is prepared for potential provisions. PFC reports an 18.4% rise in net profit for the March quarter and a 25% increase for the fiscal year, crossing ₹10 lakh crore in FY24, demonstrating improved asset quality and reduced NPAs. Sandeep Kumar, PFC's executive director, appointed as the new chief financial officer.

  • PVR Inox and Devyani International have teamed up to develop and manage food courts in Indian malls. The agreement involves the creation of a new company, with Devyani and PVR INOX investing in a 51:49 ratio respectively. Existing food court operations will remain separate until contract terms expire, and directors will be appointed according to the Shareholders’ Agreement.
Technical Analysis of BANKINDIA & CHAMBLFERT
Read More
Techincal Analysis of WIPRO & INOXWIND

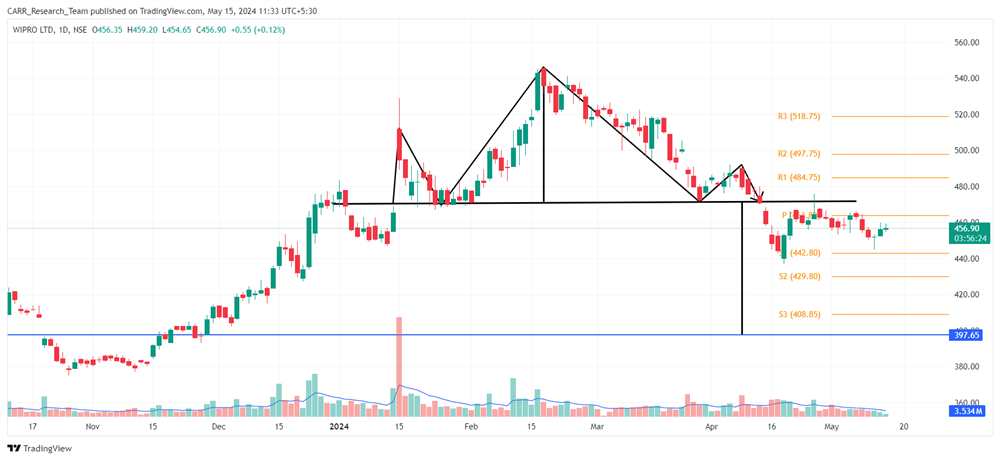
Stock name: Wipro Ltd.

Pattern: Head and shoulders pattern

Time frame: Daily

Observation:

Since November 2023, the stock has trended upward. Later, it stabilized and developed a head and shoulders pattern on its daily chart. The pattern broke out on April 12, 2024, leading to a downward movement. Presently, the stock's RSI levels indicate a low position. Technical analysis suggests that if the current breakout momentum persists, the stock might continue its downward trajectory.

You may add this to your watch list to understand further price action.

Disclaimer: This analysis is purely for educational purpose and does not contain any recommendation. Please consult your financial advisor before taking any financial decision.

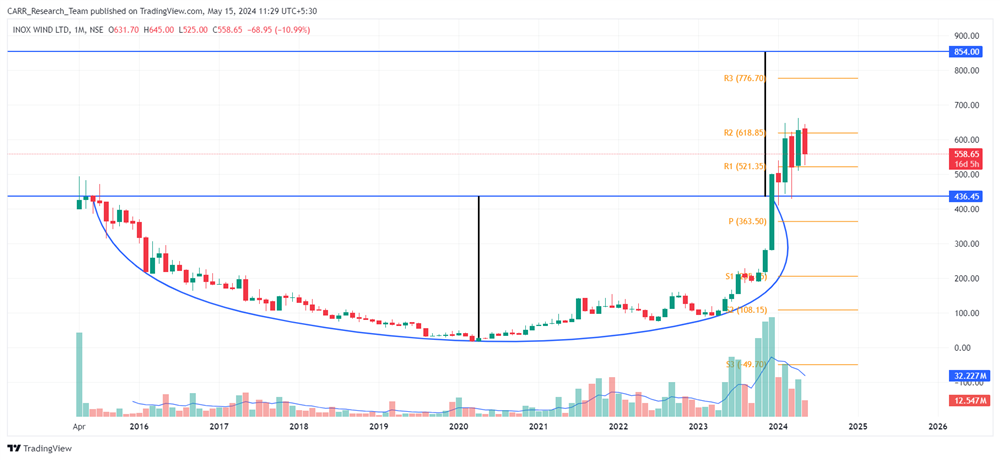
Stock name: Inox Wind Ltd.

Pattern: Rounding bottom pattern

Time frame: Monthly

Observation:

Since June 2015, the stock has been shaping a rounding bottom pattern on its monthly chart. December 2023 witnessed a breakout from this pattern, accompanied by substantial trading volume. Following the breakout, the stock has been ascending. According to technical analysis, sustaining this momentum may propel the stock further upward.

You may add this to your watch list to understand further price action.

Disclaimer: This analysis is purely for educational purpose and does not contain any recommendation. Please consult your financial advisor before taking any financial decision.


News for the day:

  • LIC has received a three-year extension from SEBI to meet the minimum public shareholding norms, easing concerns and delaying the government's potential offer for sale. This move brings relief to investors, leading to a 3% surge in LIC's stock price. SEBI regulations mandate a 25% public float, with new entities given a three-year grace period to comply. Notably, LIC, primarily owned by the Indian government, has been granted an exemption from the 25% MPS norms until 2032 by the Finance Ministry.


  • Promoters of Cipla plan to sell up to 2.53% for Rs 2,637 crore, following the company's strong annual results. The move comes amid speculation of further transactions after last year's failed $7 billion sale, leading to reported family divisions. Members of the founding Hamied family intend to offload shares via block deals, including MK Hamied's wife Shirin and daughters Samina and Rumana, along with Okasa Pharma.


  • India's coal share in power generation dips below 50% for the first time since the 1960s, with renewables dominating new capacity. G7 pledges to phase out unabated coal by 2035. India ranks third globally in solar power generation, aiming to triple renewable capacity by 2030 to combat climate change.
Techincal Analysis of WIPRO & INOXWIND
Read More
Technical Analysis of SANOFI & VIJAYA

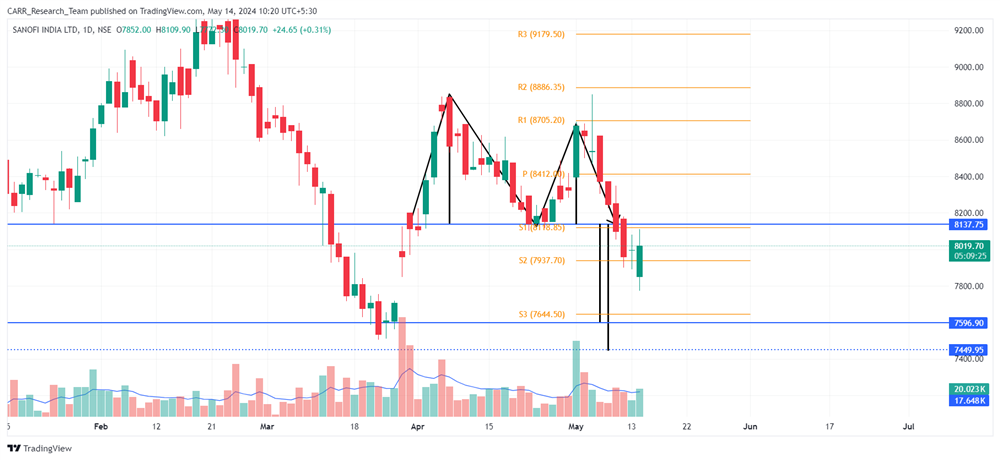
Stock name: Sanofi India Ltd.

Pattern: Double top pattern

Time frame: Daily

Observation:

The overall trend of the stock has remained in an upward direction. However recently the stock seen some consolidation and formed a double top pattern on its daily chart. On May 09, 2024, the stock registered a breakout from this pattern, supported by heightened trading volume and a bearish MACD indicator. Subsequent to the breakout, the stock has commenced a downward trajectory, accompanied by diminished levels of RSI. Technical analysis suggests that should the current momentum persist, further downward movement in the stock's price may ensue.

You may add this to your watch list to understand further price action.

Disclaimer: This analysis is purely for educational purpose and does not contain any recommendation. Please consult your financial advisor before taking any financial decision.

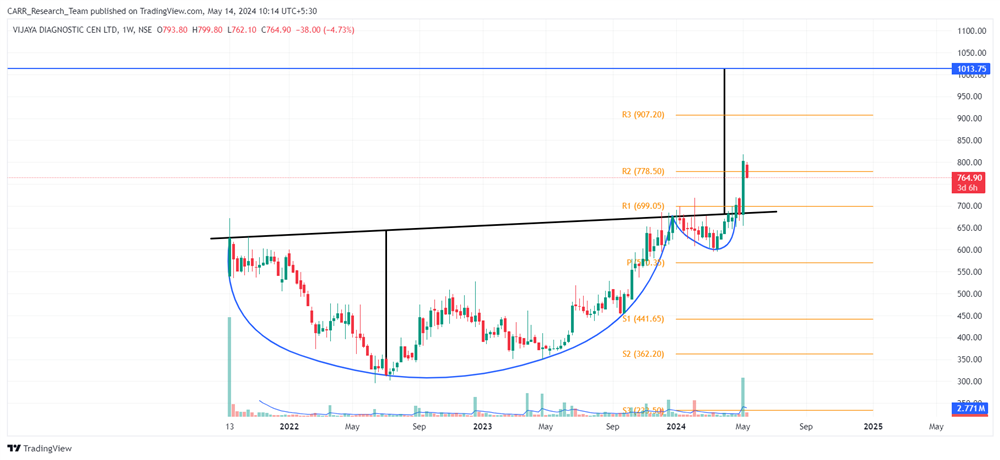
Stock name: Vijaya Diagnostic Centre Ltd.

Pattern: Cup and handle pattern

Time frame: Weekly

Observation:

Since its listing in 2021, the stock has developed a cup and handle pattern evident on its weekly chart. The stock has seen a breakout occurring in April 2024. This breakout coincided with a bullish MACD indicator and a substantial upward candle formation in May 2024. Presently, the stock's RSI levels are notably elevated. According to technical analysis, should the stock sustain its current momentum, it may see further upward movement.

You may add this to your watch list to understand further price action.

Disclaimer: This analysis is purely for educational purpose and does not contain any recommendation. Please consult your financial advisor before taking any financial decision.


News for the day:

  • Warburg Pincus acquires Shriram Housing Finance Ltd for Rs 4,630 crore, marking India's largest housing finance M&A deal. The purchase, valued at 2.8 times SHFL's net worth, enables Warburg's entry into India's affordable housing sector. SHFL's management, including Ravi Subramanian, remains unchanged, with plans for a Rs 1,000 crore equity infusion and a rebranding initiative.

  • Coromandel International Ltd has invested Rs 150 crore to acquire an additional 7% stake in Dhaksha Unmanned Systems, raising its total stake to 58%. This move emphasizes Coromandel's commitment to technology diversification. Dhaksha, specializing in UAS technology solutions and remote pilot training services, aims to expand its research, production, and fulfil a Rs 265 crore order book.

  • Zomato announced surrendering its payment aggregator licence and wrote down Rs 39 crore invested in its subsidiary Zomato Payments. Despite receiving regulatory approval, Zomato cited evolving payment landscape and lack of competitive advantage in the payments space as reasons for withdrawal. The decision aligns with RBI's stringent KYC norms for payment aggregators, with Zomato opting out of competition with established players like Razorpay and Cashfree.
Technical Analysis of SANOFI & VIJAYA
Read More
Technical Analysis of ACC & HINDALCO

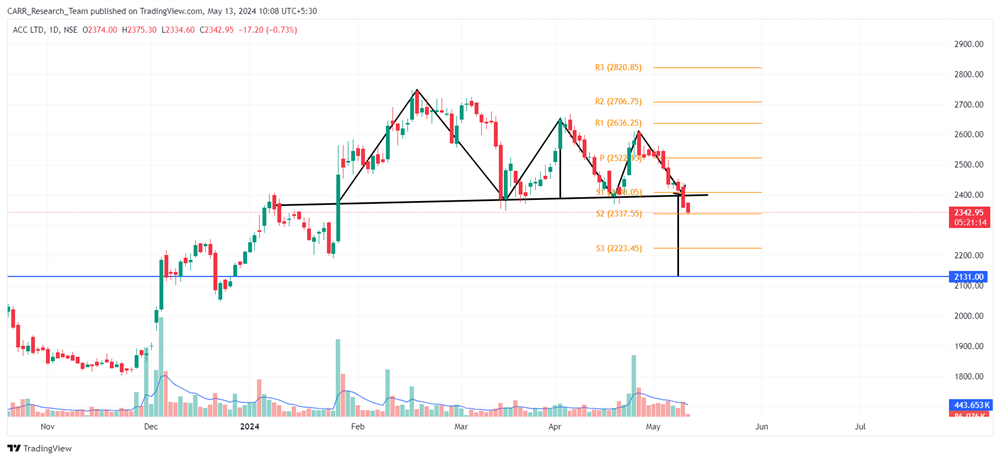
Stock name: ACC Ltd.

Pattern: Triple top pattern

Time frame: Daily

Observation:

Since March 2023, the stock has been on an upward trajectory but has recently stabilized, forming a triple top pattern on its daily chart. On May 10, 2024, it broke out from this pattern, accompanied by average trading volume and a bearish MACD indicator. Additionally, the RSI level of the stock is currently in the lower zone. Based on technical analysis, if the current momentum persists, the stock might experience further downward movement.

You may add this to your watch list to understand further price action.

Disclaimer: This analysis is purely for educational purpose and does not contain any recommendation. Please consult your financial advisor before taking any financial decision.

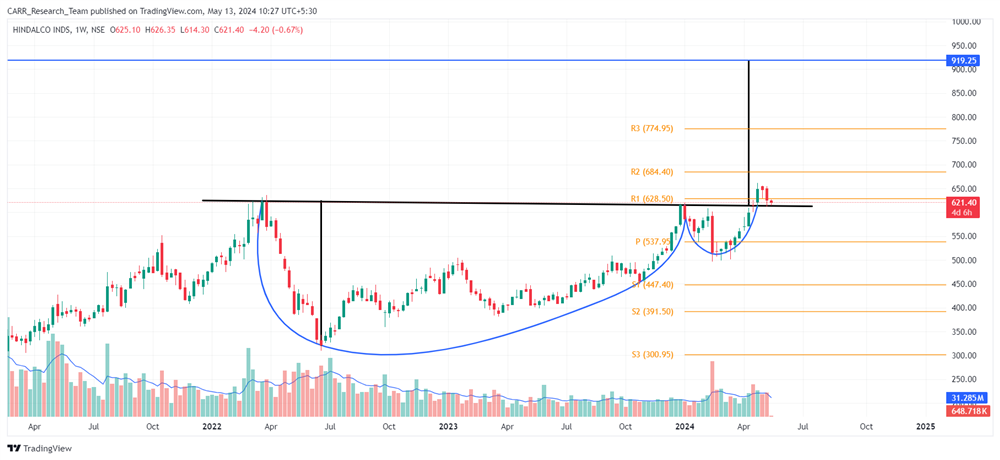
Stock name: Hindalco Industries Ltd.

Pattern: Cup and handle pattern and retest

Time frame: Weekly

Observation:

Between March 2022 and April 2024, the stock underwent a cup and handle formation on its weekly chart, culminating in a breakout in April 2024, accompanied by robust trading volume and a bullish MACD indicator. Presently, the stock is undergoing a retest of this breakout. This has led to cooling of RSI level from the overbought territory. Technical analysis suggests that a successful rebound from this retest may propel the stock in an upward trajectory.

You may add this to your watch list to understand further price action.

Disclaimer: This analysis is purely for educational purpose and does not contain any recommendation. Please consult your financial advisor before taking any financial decision.


News for the day:

  • Escorts Kubota Ltd plans to invest Rs 4,500 crore over 3-4 years in a new plant in Ghiloth, Rajasthan, aiming to double tractor production capacity to 3.4 lakh units annually and introduce new engine and construction equipment lines. Land procurement begins this fiscal year, with construction to start by year-end.

  • The Hinduja Group has received IRDAI approval to acquire Reliance Capital's insurance businesses, with a condition against pledging shares. However, approvals from RBI and CCI are pending. The NCLT has approved a resolution plan by Hinduja's IIHL, directing payment by May 27, subject to further clearances. IIHL aims to close the transaction soon, awaiting additional regulatory approvals.

  • The auditor of Zomato's subsidiaries, Batliboi & Associates, has resigned, prompting the appointment of Deloitte Haskins & Sells LLP for a more streamlined audit process. Zomato aims to align the statutory auditor of its subsidiaries with that of the holding company, enhancing efficiency. The resignation comes ahead of Zomato's board meeting to approve results for the fourth quarter and fiscal year ending March 2024, scheduled for Monday.
Technical Analysis of ACC & HINDALCO
Read More
Technical Analysis of RELIANCE & TEAMLEASE

Stock name: Reliance Industries Ltd.

Pattern: Double top pattern

Time frame: Daily

Observation:

Since October 2023, the stock has seen a consistent upward trend. Between January 2024 and May 2024, it stabilized, forming a double top pattern on its daily chart. A breakout from this pattern occurred on May 07, 2024, backed by higher-than-average trading volume. Presently, the stock's RSI levels are in a low zone. According to technical analysis, sustaining this breakout momentum may lead the stock to move downwards.

You may add this to your watch list to understand further price action.

Disclaimer: This analysis is purely for educational purpose and does not contain any recommendation. Please consult your financial advisor before taking any financial decision.

Stock name: Teamlease Services Ltd.

Pattern: Cup and handle pattern and retest

Time frame: Weekly

Observation:

Between August 2022 and April 2024, the stock stabilized, shaping a cup and handle pattern on its weekly chart. A breakout occurred in April 2024, accompanied by above-average trading volume and a bullish MACD indicator. However, the stock retraced to retest breakout levels, closing slightly below. Presently, the stock's RSI levels indicate a favorable zone. According to technical analysis, if the stock rebounds from the retest, it could continue its upward trajectory.

You may add this to your watch list to understand further price action.

Disclaimer: This analysis is purely for educational purpose and does not contain any recommendation. Please consult your financial advisor before taking any financial decision.


News for the day:

  • Tata Motors plans to merge its NBFC arms with Tata Capital ahead of the latter's IPO, aiming to streamline operations and reduce debt. This strategic move, advised by Bank of America, aligns with RBI requirements for NBFCs. Tata Motors seeks to unlock value through the IPO by monetizing its shares in Tata Capital.
  • IREDA, a state-owned entity under MNRE, has established a subsidiary named IREDA Global Green Energy Finance IFSC Limited at the International Financial Services Centre (IFSC) in GIFT City, Gujarat. This move aims to enhance IREDA's global reach and secure competitive funding for renewable energy projects. Pradip Kumar Das, Chairman & Managing Director of IREDA, anticipates that this venture will unlock fresh business opportunities and establish a global presence for IREDA in the renewable energy sector.

  • Asian Paints foresees increased rural market demand in Q1 of the fiscal year, with B2B growth expected in Q2 post-elections. However, challenges in Nepal and Egypt may affect near-term performance. Q4 earnings showed a slight rise in net profit, surpassing Rs 35,000 crore in revenue for FY2024, with resilient international business despite regional macroeconomic headwinds.
Technical Analysis of RELIANCE & TEAMLEASE
Read More
Technical Analysis of AUBANK & SAREGAMA

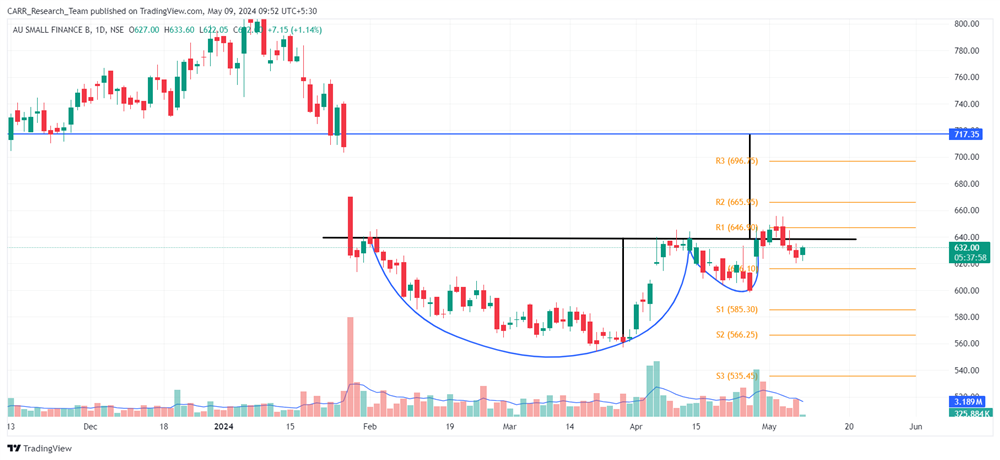
Stock name: AU Small Finance Bank Ltd.

Pattern: Cup and handle pattern and retest

Time frame: Daily

Observation:

From January 2024, the stock experienced a downward trend but later stabilized, forming a cup and handle pattern on its daily chart. It broke out from this pattern on April 29, 2024, with substantial trading volume and a positive MACD indicator. However, following the breakout, the stock underwent a significant retest, closing below the breakout level. Presently, the RSI levels of the stock remain favourable. According to technical analysis, if the stock manages to rebound from the retest, it may witness further upward movement.

You may add this to your watch list to understand further price action.

Disclaimer: This analysis is purely for educational purpose and does not contain any recommendation. Please consult your financial advisor before taking any financial decision.

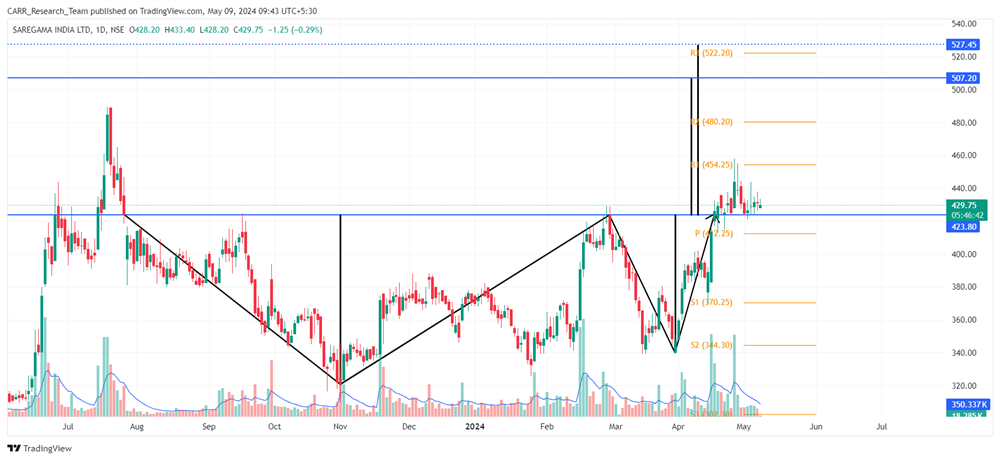
Stock name: Saregama India Ltd.

Pattern: Double bottom pattern

Time frame: Daily

Observation:

Since December 2021, the stock has been on a downward trend but stabilized from July 2023 to April 2024. During this time, it formed a double bottom pattern on its daily chart. On April 18, 2024, the stock broke out from this pattern with above-average trading volume. Following the breakout, there has been a slight upward movement in the stock. Additionally, the RSI level of the stock is in a favourable zone. As per technical analysis, the stock may see further upward movement if the breakout momentum is maintained.

You may add this to your watch list to understand further price action.

Disclaimer: This analysis is purely for educational purpose and does not contain any recommendation. Please consult your financial advisor before taking any financial decision.


News for the day:

  • TVS Supply Chain Solutions clinched a three-year deal to manage in-plant warehousing and logistics at VE Commercial Vehicles' Baggad plant in Madhya Pradesh. This extends their existing partnership since 2006. Both companies emphasize the importance of efficient logistics in maintaining production efficiency.

  • The Reserve Bank of India (RBI) has lifted restrictions on Bank of Baroda's BoB World app, permitting immediate customer onboarding through the application. Bank of Baroda confirmed the RBI's decision, stating it can now onboard customers in compliance with guidelines and regulations. This follows earlier directives in October 2023, where RBI had directed the suspension of customer onboarding on the 'BoB World' mobile app due to supervisory concerns, which Bank of Baroda addressed with corrective actions.

  • Larsen & Toubro's power transmission and distribution division has secured multiple orders in India and abroad. Projects include floating solar plants in India, transmission lines, and substations to integrate solar energy zones in Rajasthan and Karnataka. Overseas, L&T will build a gas insulated substation in Oman and substations in the United Arab Emirates, contributing to grid strengthening initiatives.
Technical Analysis of AUBANK & SAREGAMA
Read More