Filter
RSS

Blog posts of '2025' 'January'

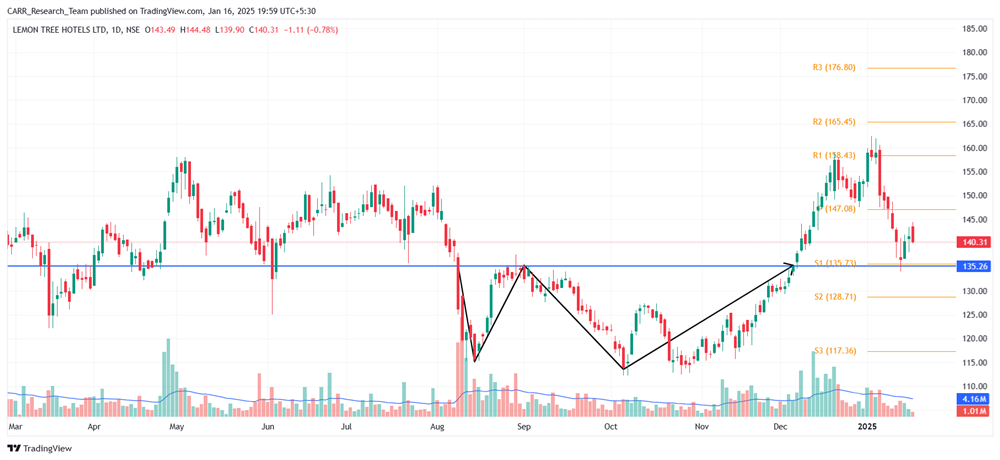
Stock name: Lemon Tree Hotels Ltd.

Pattern: Double bottom pattern

Time frame: Daily

Observation:

In our blog dated December 10, 2024 (link for reference), we noted the stock forming a double bottom pattern on its daily chart. Following a breakout on December 6, 2024, the stock rallied upward, reaching a new all-time high on January 2, 2025. Since then, the stock has retraced, cooling off and falling back to the breakout level.

You may add this to your watch list to understand further price action.

Disclaimer: This analysis is purely for educational purpose and does not contain any recommendation. Please consult your financial advisor before taking any financial decision.

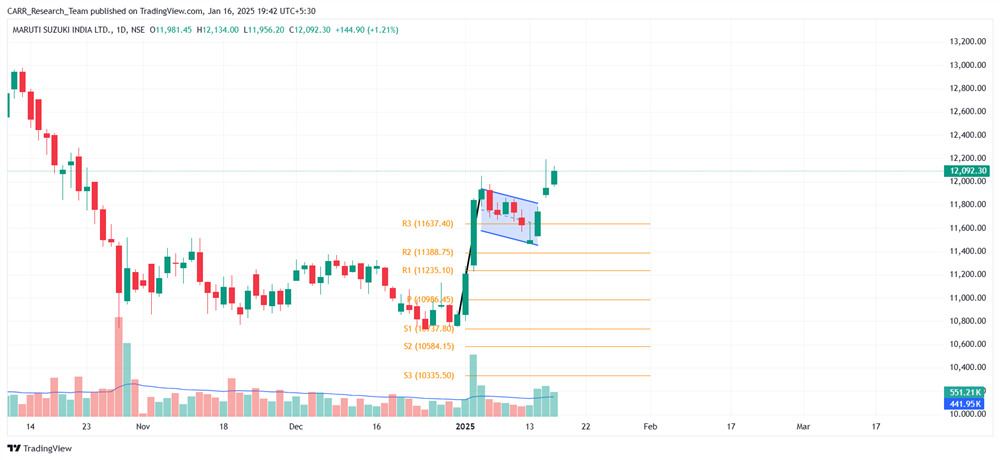
Stock name: Maruti Suzuki India Ltd.

Pattern: Flag and pole pattern

Time frame: Daily

Observation:

Since November 2024, the stock has been consolidating. In early January 2025, it experienced a sharp upward movement, followed by renewed consolidation starting January 3, 2025, forming a flag and pole pattern on the daily chart. In recent sessions, the stock regained upward momentum and broke out of the pattern. According to technical analysis, if the stock sustains this momentum, it may witness further gains. It's advisable to look for additional confirmations, such as RSI levels and the MACD indicator.

You may add this to your watch list to understand further price action.

Disclaimer: This analysis is purely for educational purpose and does not contain any recommendation. Please consult your financial advisor before taking any financial decision.


Technical Analysis of LEMONTREE & MARUTI
Read More
Technical Analysis of RATNAMANI & ADANIPOWER

Stock name: Ratnamani Metals & Tubes Ltd.

Pattern: Head and shoulders pattern

Time frame: Daily

Observation:

In continuation of our blog from December 17, 2024 (link for reference), the stock has formed a head and shoulders pattern on its daily chart. By late November 2024, it registered a breakdown from this pattern, signalling bearish momentum. Following the breakdown, the stock sustained its downward trajectory, which was further validated by several red candles accompanied by high volumes, reinforcing the bearish sentiment.

You may add this to your watch list to understand further price action.

Disclaimer: This analysis is purely for educational purpose and does not contain any recommendation. Please consult your financial advisor before taking any financial decision.

Stock name: Adani Power Ltd.

Pattern: Support and reversal

Time frame: Daily

Observation:

The stock hit a previous high in August 2022, forming a resistance line at this level. In November 2023, it broke above this resistance, which then acted as support, driving an upward move until June 2024 when it registered a new all-time high (ATH). After a decline, the stock returned to this support level in November 2024 and rebounded. On January 14, 2025, it showed a similar rebound with strong volume. If the stock sustains its rebound momentum, technical analysis suggests that the stock may see further gains. It's advisable to look for additional confirmations, such as RSI levels and the MACD indicator.

You may add this to your watch list to understand further price action.

Disclaimer: This analysis is purely for educational purpose and does not contain any recommendation. Please consult your financial advisor before taking any financial decision.

Technical Analysis of RATNAMANI & ADANIPOWER
Read More
Technical Analysis of NH & METROPOLIS

Stock name: Narayana Hrudayalaya Ltd.

Pattern: Resistance and reversal

Time frame: Daily

Observation:

Since November 2023, the stock has been trading sideways, forming a parallel channel on the daily chart. In January 2025, it touched the resistance line and reversed, accompanied by strong trading volumes. A series of red candles followed, signalling rapid downward movement. If this momentum persists, technical analysis suggests the stock may decline further. It's advisable to look for additional confirmations, such as RSI levels and the MACD indicator.

You may add this to your watch list to understand further price action.

Disclaimer: This analysis is purely for educational purpose and does not contain any recommendation. Please consult your financial advisor before taking any financial decision.

Stock name: Metropolis Healthcare Ltd.

Pattern: Double top pattern

Time frame: Daily

Observation:

The stock has been on an upward trend since May 2023. Between August 2024 and January 2025, it formed a double top pattern on the daily chart. On January 3, the stock broke down from the pattern with strong trading volumes but quickly retested the breakdown level. It has since resumed its descent with multiple red candles, and if the current momentum persists, technical analysis indicates that it may decline further. It's advisable to look for additional confirmations, such as RSI levels and the MACD indicator.

You may add this to your watch list to understand further price action.

Disclaimer: This analysis is purely for educational purpose and does not contain any recommendation. Please consult your financial advisor before taking any financial decision.

Technical Analysis of NH & METROPOLIS
Read More
Technical Analysis of SWANENERGY & POONAWALLA

Stock name: Swan Energy Ltd.

Pattern: Resistance and reversal

Time frame: Weekly

Observation:

The stock maintained an upward trend, reaching its previous all-time high (ATH) in February 2024. It then consolidated, moving sideways within a parallel channel on the weekly chart. In November 2024, the stock experienced a strong upward move, breaking out to a new ATH at the channel's resistance level. However, it quickly reversed from this resistance and began a downward move. Based on technical analysis, the stock may continue to decline further. It's advisable to look for additional confirmations, such as RSI levels and the MACD indicator.

You may add this to your watch list to understand further price action.

Disclaimer: This analysis is purely for educational purpose and does not contain any recommendation. Please consult your financial advisor before taking any financial decision.

Stock name: Poonawalla Fincorp Ltd.

Pattern: Head and shoulders pattern and retest

Time frame: Weekly

Observation:

Since the COVID period, the stock has been on an upward trend. However, between July 2023 and October 2024, it formed a head-and-shoulders pattern on the weekly chart. In October 2024, the stock broke down from this pattern but quickly retested the breakdown level on the next candle. Following the retest, the stock resumed its downward move and is now trading below the breakdown level. As per technical analysis the stock may see further decline if the current momentum persists. It's advisable to look for additional confirmations, such as RSI levels and the MACD indicator.

You may add this to your watch list to understand further price action.

Disclaimer: This analysis is purely for educational purpose and does not contain any recommendation. Please consult your financial advisor before taking any financial decision.

Technical Analysis of SWANENERGY & POONAWALLA
Read More
Technical Analysis of ANGELONE & SOBHA

Stock name: Angel One Ltd.

Pattern: Inverse head and shoulders pattern and retest

Time frame: Daily

Observation:

In our previous blog dated November 7, 2024 (link for reference), we highlighted an inverse head and shoulders pattern on the stock's daily chart. Following a breakout on October 15, 2024, the stock retested the breakout level and rebounded by November 14, 2024. It then gained upward momentum, reaching its high by December 9, 2024. Later on, the stock has since declined from that level.

You may add this to your watch list to understand further price action.

Disclaimer: This analysis is purely for educational purpose and does not contain any recommendation. Please consult your financial advisor before taking any financial decision.

Stock name: Sobha Ltd.

Pattern: Double top pattern and retest

Time frame: Daily

Observation:

The stock has been in an upward trend since March 2023. However, between May and October 2024, it formed a double-top pattern on the daily chart, breaking down from the pattern by late October 2024. Despite the breakdown, downward momentum was initially limited due to low volumes. After retesting the breakdown level, the stock resumed its decline from December 10, 2024, with sustained downward movement. Notably, it has formed large red candles with high volumes in the last two trading sessions, suggesting that if the current momentum persists, the stock may decline further as per technical analysis. It's advisable to look for additional confirmations, such as RSI levels and the MACD indicator.

You may add this to your watch list to understand further price action.

Disclaimer: This analysis is purely for educational purpose and does not contain any recommendation. Please consult your financial advisor before taking any financial decision.

Technical Analysis of ANGELONE & SOBHA
Read More
Technical Analysis of HEROMOTOCO and VARROC

Stock name: Hero MotoCorp Ltd.

Pattern: Double top pattern

Time frame: Daily

Observation:

As highlighted in our previous blog on November 12, 2024 (link for reference), the stock had formed a double top pattern on its daily chart. Following a breakdown and retest, it resumed its downward trajectory from November 4, 2024, ultimately achieving the target projected by the technical pattern. The stock is now trading at a critical support level, making its next movement an important development to watch.

You may add this to your watch list to understand further price action.

Disclaimer: This analysis is purely for educational purpose and does not contain any recommendation. Please consult your financial advisor before taking any financial decision.

Stock name: Varroc Engineering Ltd.

Pattern: Double bottom pattern and retest

Time frame: Daily

Observation:

Since June 2024, the stock has been in a downtrend. Between August and December 2024, it formed a double bottom on the daily chart and broke out of the pattern on December 10, 2024, with strong volumes and upward momentum. Shortly after, the stock retested the breakout level but rebounded by late December. On January 2, 2025, it formed a green candle with significant volumes, suggesting that maintaining the rebound momentum may lead to further gains. It's advisable to look for additional confirmations, such as RSI levels and the MACD indicator.

You may add this to your watch list to understand further price action.

Disclaimer: This analysis is purely for educational purpose and does not contain any recommendation. Please consult your financial advisor before taking any financial decision.

Technical Analysis of HEROMOTOCO and VARROC
Read More
Technical Analysis of MAHSEAMLES & AEGISLOG

Stock name: Maharashtra Seamless Ltd.

Pattern: Double bottom pattern and retest

Time frame: Daily

Observation:

The stock has been in a downtrend since January 2024 but formed a double bottom pattern on its daily chart from June to December 2024. In early December 2024, it registered a significant breakout with strong trading volume. Subsequently, the stock retested the breakout level and rebounded with good volume on January 1, 2025. According to technical analysis, if the rebound momentum continues, the stock may see further upward movement. It's advisable to look for additional confirmations, such as RSI levels and the MACD indicator.

You may add this to your watch list to understand further price action.

Disclaimer: This analysis is purely for educational purpose and does not contain any recommendation. Please consult your financial advisor before taking any financial decision.

Stock name: Aegis Logistics Ltd.

Pattern: Cup and handle pattern

Time frame: Daily

Observation:

Since March 2024, the stock has been in an uptrend and formed a cup and handle pattern on its daily chart between June 2024 and January 2025. In early January 2025, it experienced a strong breakout from the pattern, accompanied by significant trading volume. According to technical analysis, the stock's current momentum suggests that it may see further upward movement. It's advisable to look for additional confirmations, such as RSI levels and the MACD indicator.

You may add this to your watch list to understand further price action.

Disclaimer: This analysis is purely for educational purpose and does not contain any recommendation. Please consult your financial advisor before taking any financial decision.

Technical Analysis of MAHSEAMLES & AEGISLOG
Read More

Stock name: Bharat Forge Ltd.

Pattern: Head and shoulders pattern

Time frame: Daily

Observation:

The stock experienced a sharp upward rally starting in February 2024, reaching its all-time high (ATH) around June 2024. It then cooled off, forming a head-and-shoulders pattern on the daily chart. A decisive breakdown from the pattern occurred in early November 2024, despite low trading volumes, with the stock continuing its downward movement. Recently, a red candle with significant volume reinforced the bearish momentum, and technical analysis suggests the stock may decline further. It's advisable to look for additional confirmations, such as RSI levels and the MACD indicator.

You may add this to your watch list to understand further price action.

Disclaimer: This analysis is purely for educational purpose and does not contain any recommendation. Please consult your financial advisor before taking any financial decision.

Stock name: JSW Energy Ltd.

Pattern: Triple top pattern and retest

Time frame: Daily

Observation:

The stock has been in an uptrend from March 2023 onwards but consolidated between June and December 2024, forming a triple-top pattern on the daily chart. It broke down from the pattern on December 26, 2024, with low trading volumes. During the subsequent retest, the stock formed a red candle with significant volumes, signalling selling pressure. Having completed the retest, the stock is now moving downward, and if the current momentum persists, the stock may decline further as per technical analysis. It's advisable to look for additional confirmations, such as RSI levels and the MACD indicator.

You may add this to your watch list to understand further price action.

Disclaimer: This analysis is purely for educational purpose and does not contain any recommendation. Please consult your financial advisor before taking any financial decision.

Technical Analysis of BHARATFORG & JSWENERGY
Read More
Technical Analysis of HINDALCO & AWL

Stock name: Hindalco Industries Ltd.

Pattern: Head and shoulders pattern

Time frame: Weekly

Observation:

The stock has been in an uptrend since June 2022 but formed a head and shoulders pattern on the weekly chart between April 2024 and December 2024. A breakout from this pattern occurred in the last candle of December 2024. If the breakout momentum persists, technical analysis indicates that the stock may see further downward movement. It's advisable to look for additional confirmations, such as RSI levels and the MACD indicator.

You may add this to your watch list to understand further price action.

Disclaimer: This analysis is purely for educational purpose and does not contain any recommendation. Please consult your financial advisor before taking any financial decision.

Stock name: Adani Wilmar Ltd.

Pattern: Support and reversal

Time frame: Weekly

Observation:

After a downward trend since September 2022, the stock entered a consolidation phase starting in July 2023, forming a parallel channel on the weekly chart. By late November 2024, it reached the channel's support level and showed rebound momentum in the last two candles of December. If this momentum sustains, technical analysis suggests that the stock may see some upward movement. It's advisable to look for additional confirmations, such as RSI levels and the MACD indicator.

You may add this to your watch list to understand further price action.

Disclaimer: This analysis is purely for educational purpose and does not contain any recommendation. Please consult your financial advisor before taking any financial decision.

Technical Analysis of HINDALCO & AWL
Read More