Learning chart patterns enables traders to anticipate potential trend reversals and structure their trades accordingly. One of the most reliable bullish reversal patterns is the Morning Star. Identifying this formation early can help traders prepare for upward price movements and avoid short positions near potential market bottoms.
A Morning Star is a bullish reversal pattern that appears after a downtrend, signalling the exhaustion of selling pressure and the possible start of a new uptrend. This three-candle pattern reflects a shift in sentiment from bearish to bullish.
Anatomy of the Morning Star Pattern
First Candle – Bearish: The pattern begins with a large bearish candle that confirms the prevailing downtrend. It reflects strong selling pressure and bearish sentiment.
Second Candle – Indecision (Star): The next candle is small-bodied — it can be bullish, bearish, or a Doji. It gaps down from the first candle’s close, indicating uncertainty or indecision in the market. This candle forms the “star” and hints at a potential pause in the downtrend.
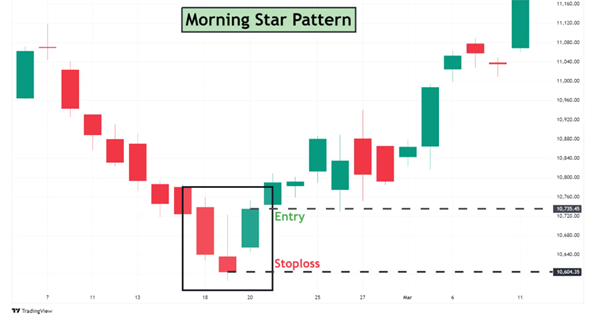
Third Candle – Bullish Confirmation: The final candle is a strong bullish candle that closes well into the body of the first bearish candle (at least 50%) or above the first candle. It confirms the reversal, as buyers step in with conviction.
How to Trade the Morning Star Pattern
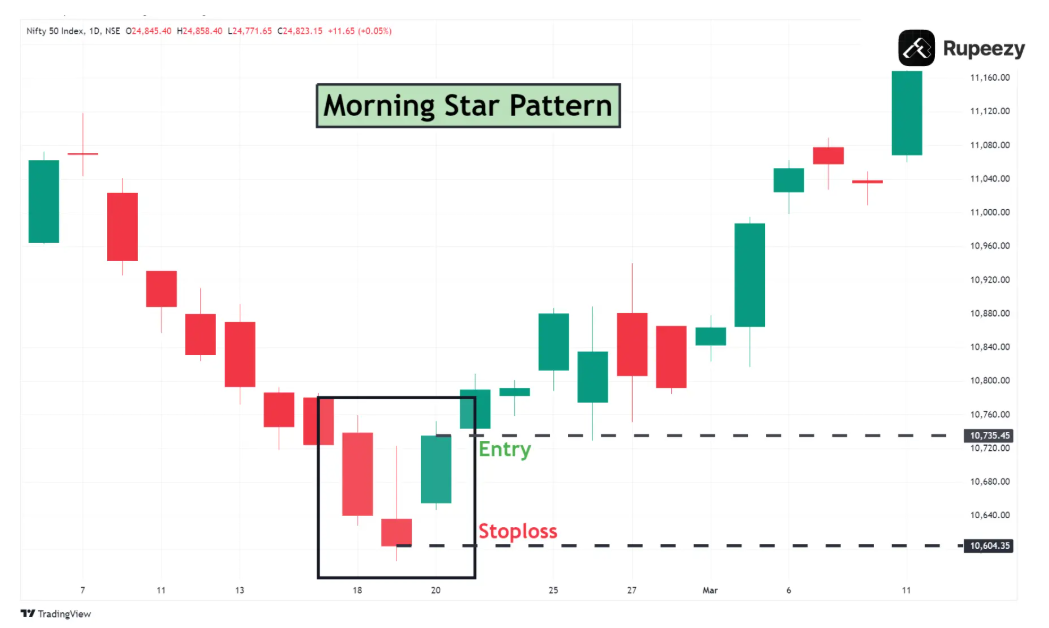
Entry Point
· Enter a long position when the third candle closes above the midpoint of the first bearish candle.
· Alternatively, wait for a slight pullback after the third candle and enter on signs of continued bullish momentum (e.g., bullish engulfing on a lower timeframe).
· As with any pattern, traders may scale in — for example, 50% on the pattern confirmation and 50% on a pullback or support retest.
Target Price: Two common approaches to estimate upside targets:
Chart-Based Target:
· Measure the distance from the low of the star to the high of the first candle.
· Add this distance to the high of the third candle to project a potential target.
· Target = Third Candle High + (First Candle High – Star Low)

Fibonacci Retracement or Pivot Points:
· Use tools like the Fibonacci extension or previous resistance zones to validate your target.
Stop-Loss Placement
· Place the stop-loss just below the low of the star candle to protect against a failed reversal.
· If entering on a pullback, a tighter stop just below the third candle’s low can be used.
· Be cautious of overly tight stops in volatile markets.
Additional Tips
· Morning Star patterns are most effective after a prolonged downtrend — in sideways markets, their reliability decreases.
· Volume typically decreases during the first candle and then picks up significantly during the third bullish candle.
· Use confirmation from indicators like RSI divergence (higher lows on RSI while price makes lower lows) or a bullish MACD crossover.
· A well-formed Morning Star with a clear separation between the first and second candles enhances the pattern’s strength.
· Morning star pattern can be a start of new uptrend especially if formed around key support zones.
Charting Exercise: Switch to a daily chart and scan for potential Morning Star formations. Clearly mark:
· First Bearish Candle
· Star (second candle showing indecision)
· Third Bullish Candle (confirmation)
· Entry point (close of the third candle)
· Target and stop-loss levels
Use horizontal lines to mark key support and resistance levels. Measure the vertical range of the pattern and project it upwards for a conservative target. Confirm the bullish reversal with a rise in volume on the third candle.
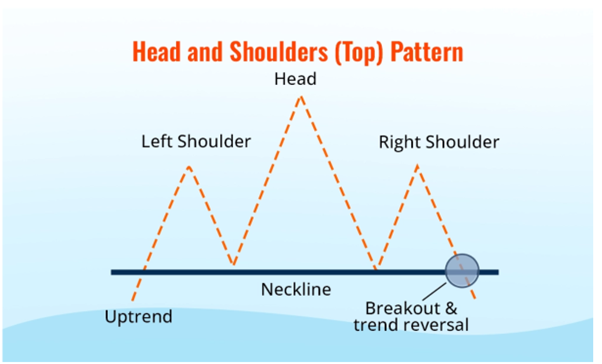
Homework: Study the following stocks and check if a Head and Shoulders pattern is forming or has recently completed:
1. Asian Paints Ltd. (ASIANPAINT)
2. REC Ltd. (RECLTD)
You may also add the stock to your watch list to understand further price action.
Disclaimer: This analysis is purely for educational purpose and does not contain any recommendation. Please consult your financial advisor before taking any financial decision.