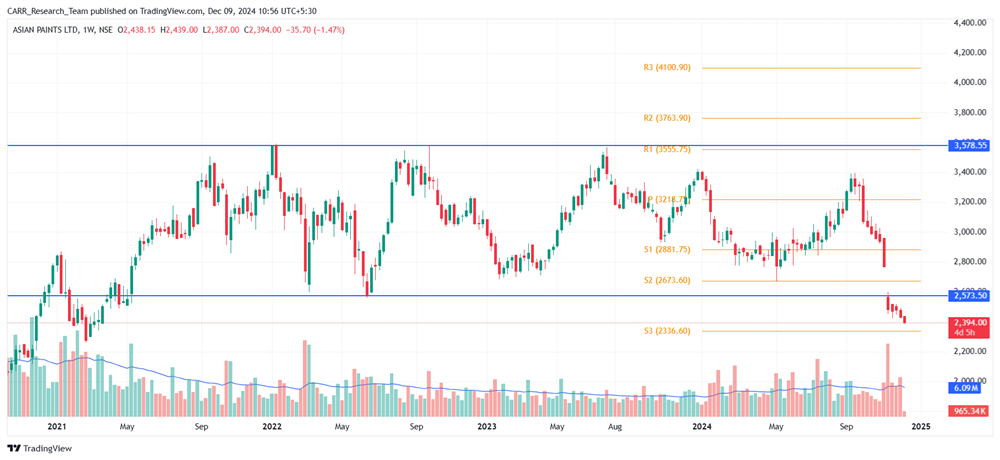
Stock name: Asian Paints Ltd.
Pattern: Support breakdown
Time frame: Weekly
Observation:
The stock has been trading within a parallel channel since May 2021. It has seen a sharp downward movement in September 2024. In November 2024, it experienced a significant gap-down breakdown below the channel's support level. Following this, the stock continued its decline with successive bearish candles. Technical analysis suggests that if the current momentum persists, the stock may see further downward movement. It's advisable to look for additional confirmations, such as RSI levels and the MACD indicator.

You may add this to your watch list to understand further price action.
Disclaimer: This analysis is purely for educational purpose and does not contain any recommendation. Please consult your financial advisor before taking any financial decision.
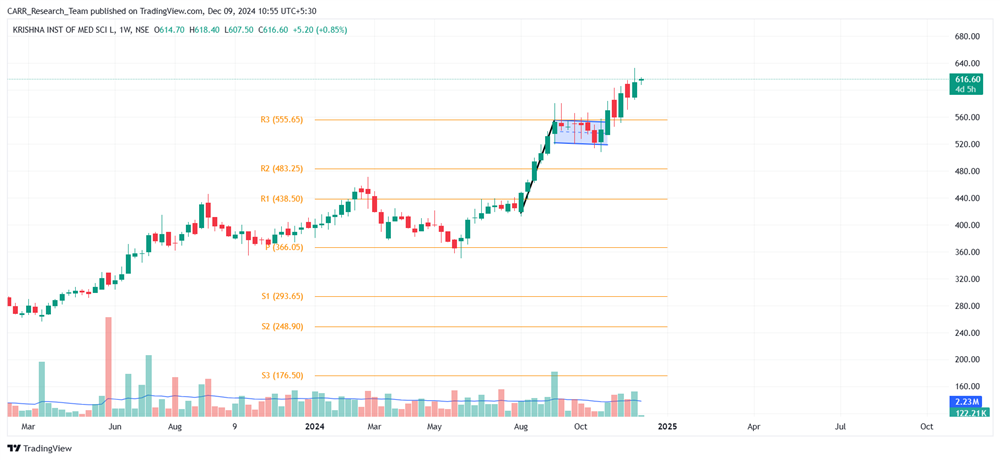
Stock name: Krishna Institute of Medical Sciences Ltd.
Pattern: Flag and pole pattern
Time frame: Weekly
Observation:
Listed on the NSE in June 2021, the stock has been in an upward trend from the get go. It saw a rapid surge in August and early September 2024 before entering a consolidation phase from September 9, forming a flag and pole pattern on the weekly chart. A breakout from this pattern occurred in November 2024, after which the stock resumed its upward trajectory. Technical analysis indicates that if the current momentum sustains, the stock may rise further. It's advisable to look for additional confirmations, such as RSI levels and the MACD indicator.

You may add this to your watch list to understand further price action.
Disclaimer: This analysis is purely for educational purpose and does not contain any recommendation. Please consult your financial advisor before taking any financial decision.


