
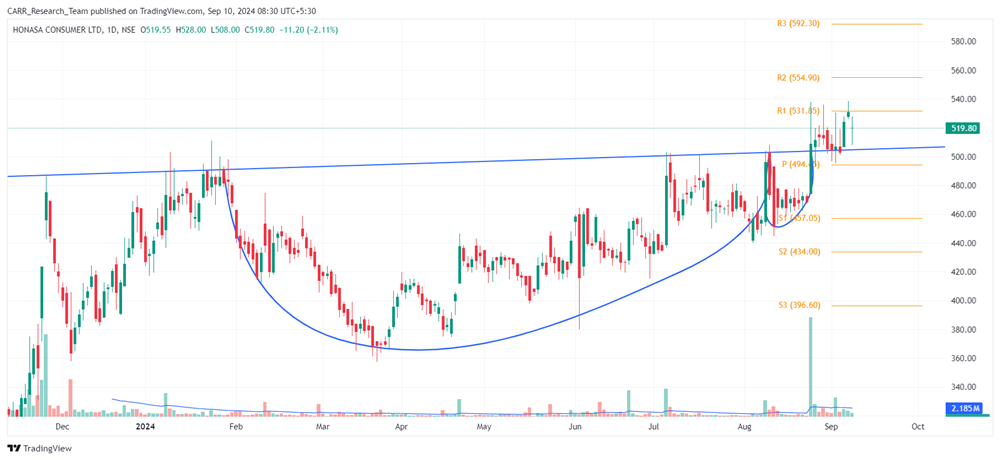
Stock name: Honasa Consumer Ltd.
Pattern: Cup and handle pattern and retest
Time frame: Daily
Observation:
Since its listing in November 2023, the stock has experienced upward momentum. From January 2024, it stabilized and formed a cup and handle pattern on the daily chart. A breakout occurred on 26 August 2024, supported by high trading volume. Though the stock has seen retest after the breakout, it was able to sustained the breakout level. In last 2-3 trading sessions, it has moved slightly higher. According to technical analysis, if the stock gains further momentum, it may continue its upward movement. It's advisable to look for additional confirmations, such as RSI levels and the MACD indicator.
You may add this to your watch list to understand further price action.
Disclaimer: This analysis is purely for educational purpose and does not contain any recommendation. Please consult your financial advisor before taking any financial decision.

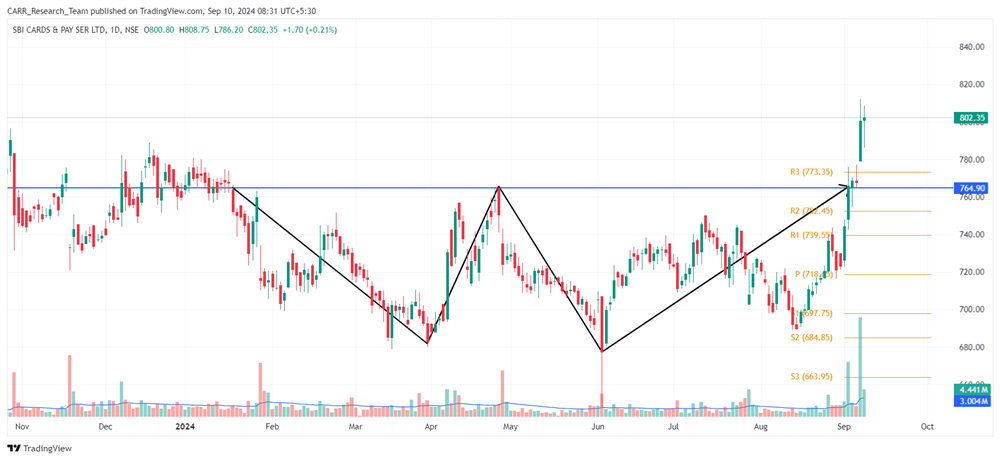
Stock name: SBI Cards and Payment Services Ltd.
Pattern: Double bottom pattern
Time frame: Daily
Observation:
The stock had been in a downtrend for some years now. It has stabilized between January and September 2024, forming a double bottom on its daily chart. It broke out from this pattern on 03 September 2024 with significant volume. A subsequent confirmation came with a strong green candle and higher volume. If the stock maintains its current momentum, it may continue to rise further according to technical analysis. It's advisable to look for additional confirmations, such as RSI levels and the MACD indicator.
You may add this to your watch list to understand further price action.
Disclaimer: This analysis is purely for educational purpose and does not contain any recommendation. Please consult your financial advisor before taking any financial decision.


