
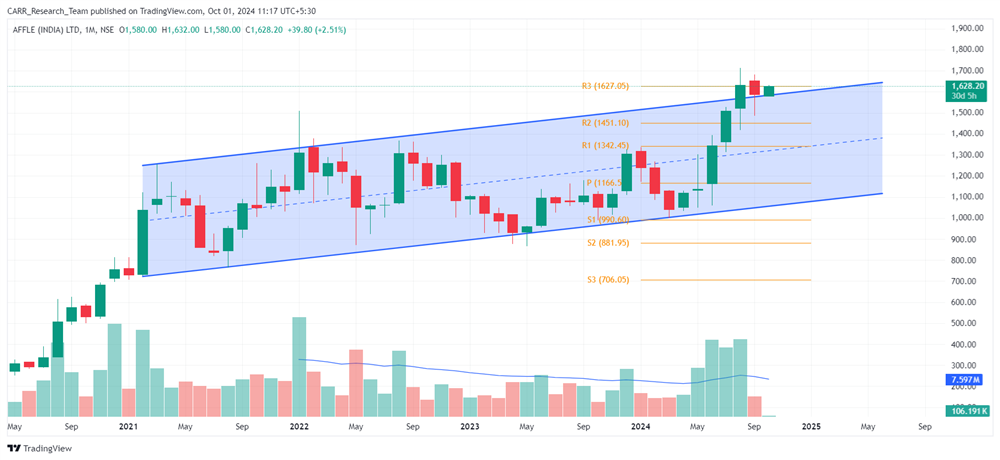
Stock name: Affle (India) Ltd.
Pattern: Resistance breakout
Time frame: Monthly
Observation:
The stock had been seen consolidation from February 2021 onwards. This has led to movement in a parallel channel on the monthly chart. In the month of August 2024, the stock has registered a breakout from the pattern with a support of good volume. The stock was able to sustain the breakout level in the following month. According to technical analysis, if the stock can maintain upward momentum, it may experience further gains. It's advisable to look for additional confirmations, such as RSI levels and the MACD indicator.
You may add this to your watch list to understand further price action.
Disclaimer: This analysis is purely for educational purpose and does not contain any recommendation. Please consult your financial advisor before taking any financial decision.

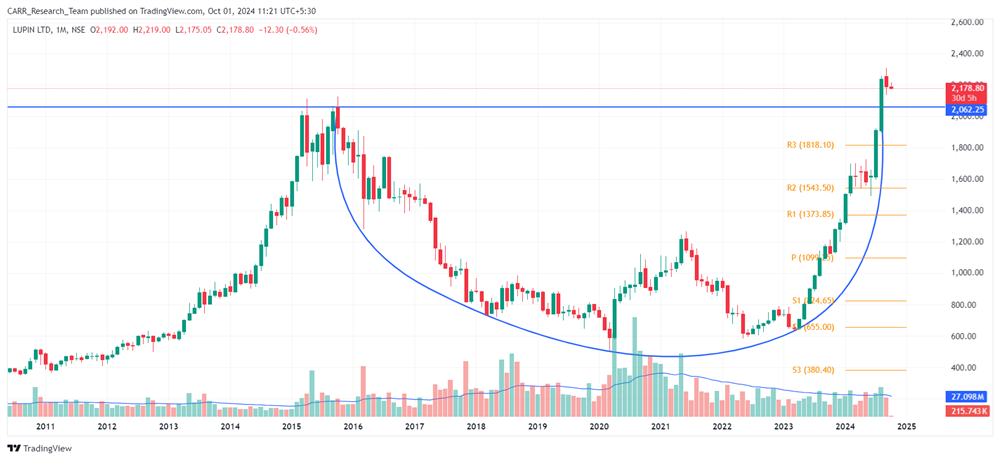
Stock name: Lupin Ltd.
Pattern: Rounding bottom pattern
Time frame: Monthly
Observation:
The stock reached its previous all-time high in October 2015 and has been in a downward trend since. However, from 2023, it started to recover, forming a rounding bottom pattern on the monthly chart from 2015 to 2024. In August 2024, the stock broke out of this pattern, and the following candle maintained the breakout level. If it sustains this momentum, then as per technical analysis the stock may see further upward movement. It's advisable to look for additional confirmations, such as RSI levels and the MACD indicator.
You may add this to your watch list to understand further price action.
Disclaimer: This analysis is purely for educational purpose and does not contain any recommendation. Please consult your financial advisor before taking any financial decision.


