
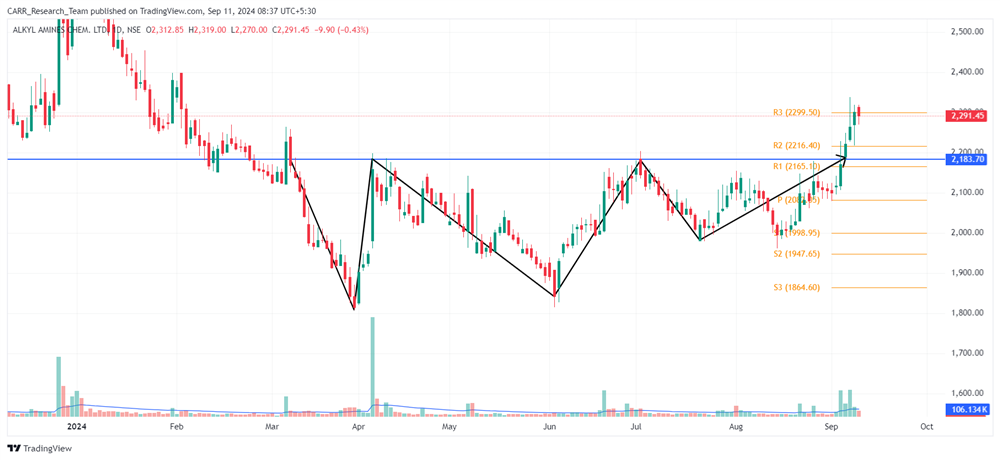
Stock name: Alkyl Amines Chemicals Ltd.
Pattern: Triple bottom pattern
Time frame: Daily
Observation:
The stock experienced a downward trend since 2021 but stabilized in March 2024, forming a triple bottom pattern on the daily chart. In the first week of September 2024, it broke out of the pattern, supported by strong trading volume, and began moving upward. As per technical analysis, if the stock can sustain this momentum, it may see further upward movement. It's advisable to look for additional confirmations, such as RSI levels and the MACD indicator.
You may add this to your watch list to understand further price action.
Disclaimer: This analysis is purely for educational purpose and does not contain any recommendation. Please consult your financial advisor before taking any financial decision.

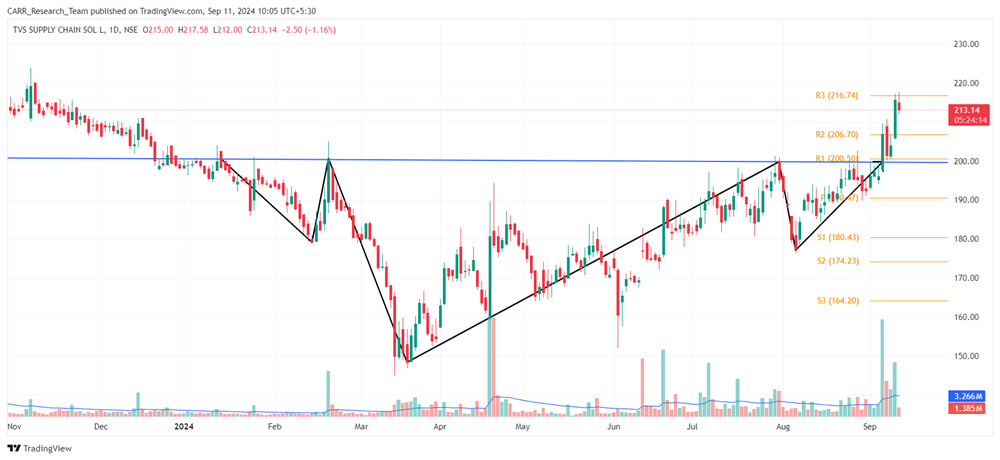
Stock name: TVS Supply Chain Solutions Ltd.
Pattern: Inverse head and shoulders pattern
Time frame: Daily
Observation:
After its listing, the stock entered a downward trend. From January to September 2024, it formed an inverse head and shoulders pattern on the daily chart. On 5th September 2024, the stock broke out of the pattern with strong trading volume, and has since moved upward with continued volume support. If it maintains this momentum, technical analysis suggests that the stock may see further upward movement. It's advisable to look for additional confirmations, such as RSI levels and the MACD indicator.
You may add this to your watch list to understand further price action.
Disclaimer: This analysis is purely for educational purpose and does not contain any recommendation. Please consult your financial advisor before taking any financial decision.


