
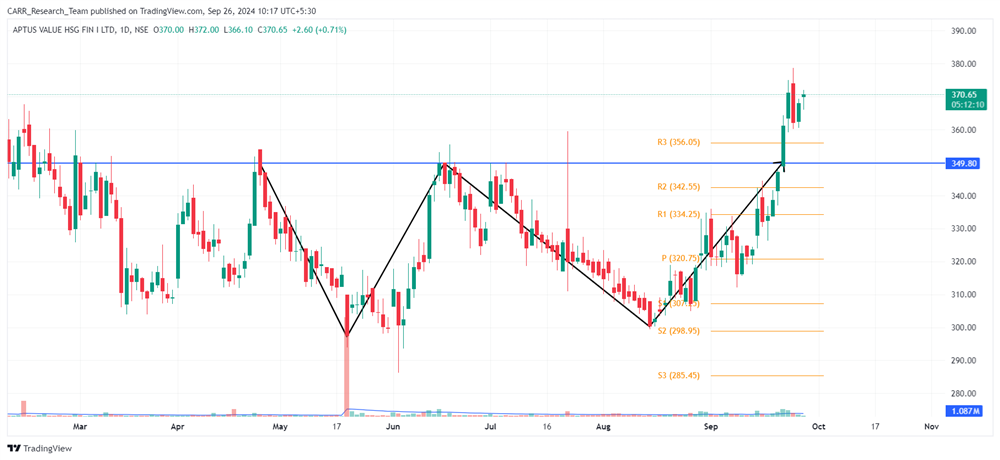
Stock name: Aptus Value Housing Finance India Ltd.
Pattern: Double bottom pattern
Time frame: Daily
Observation:
The stock experienced a downward movement starting in February 2024. Between April and September 2024, it formed a double bottom pattern, with a breakout occurring on 20th September 2024, supported by strong volume. The stock has maintained its position above the breakout level in the following sessions. According to technical analysis, if the momentum persists, the stock may see further upward movement. It's advisable to look for additional confirmations, such as RSI levels and the MACD indicator.
You may add this to your watch list to understand further price action.
Disclaimer: This analysis is purely for educational purpose and does not contain any recommendation. Please consult your financial advisor before taking any financial decision.

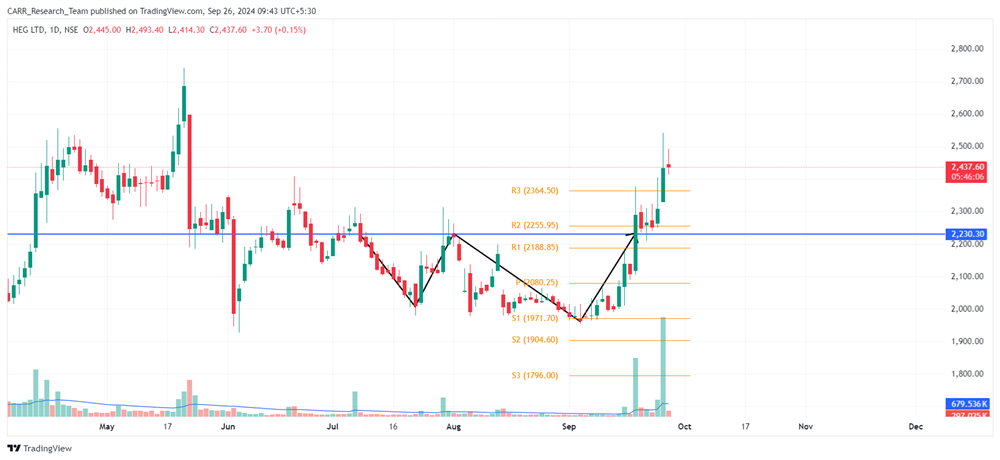
Stock name: H.E.G. Ltd.
Pattern: Double bottom pattern
Time frame: Daily
Observation:
The stock began moving downward in May 2024. Between July and September 2024, it formed a double bottom pattern on the daily chart, breaking out on 18th September 2024 with strong volume. On 25th September 2024, the stock continued its upward movement, again supported by good volume. According to technical analysis, if the breakout momentum holds, it may see further gains. It's advisable to look for additional confirmations, such as RSI levels and the MACD indicator.
You may add this to your watch list to understand further price action.
Disclaimer: This analysis is purely for educational purpose and does not contain any recommendation. Please consult your financial advisor before taking any financial decision.


