
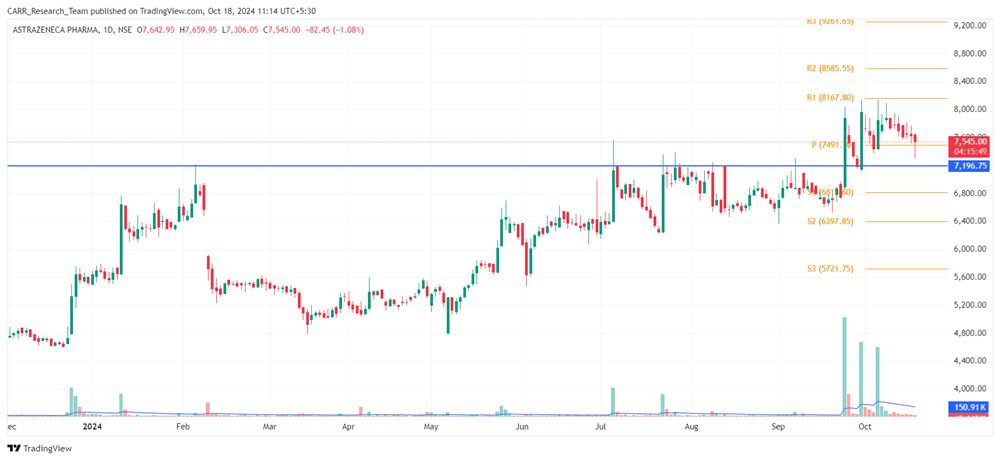
Stock name: AstraZenca Pharma India Ltd.
Pattern: Resistance breakout and retest
Time frame: Daily
Observation:
After an initial rise, the stock has been consolidating since February 2024, forming a resistance line on the daily chart. It repeatedly tested this line until a breakout occurred on September 24, 2024, with strong volume. The stock has since retested the breakout and rebounded, though it currently lacks the momentum to sustain the move. According to technical analysis, if momentum builds, the stock may see further upward movement. It's advisable to look for additional confirmations, such as RSI levels and the MACD indicator.
You may add this to your watch list to understand further price action.
Disclaimer: This analysis is purely for educational purpose and does not contain any recommendation. Please consult your financial advisor before taking any financial decision.

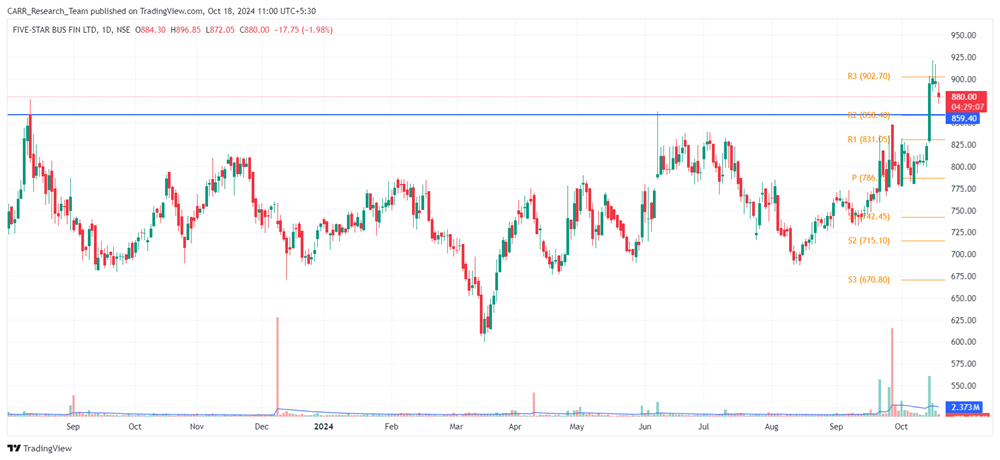
Stock name: Five-Star Business Finance Ltd.
Pattern: Resistance breakout
Time frame: Daily
Observation:
The stock reached its previous all-time high (ATH) in August 2023 and has since consolidated, facing resistance at that level. It attempted to break past the resistance multiple times before a significant movement on October 15, 2024. With strong trading volume, the stock broke through the resistance and surpassed its previous ATH. Currently, it is holding above the breakout level. According to technical analysis, if the stock can maintain the breakout momentum, it may experience further upward movement. It's advisable to look for additional confirmations, such as RSI levels and the MACD indicator.
You may add this to your watch list to understand further price action.
Disclaimer: This analysis is purely for educational purpose and does not contain any recommendation. Please consult your financial advisor before taking any financial decision.


