
Stock name: AU Small Finance Bank Ltd.
Pattern: Double bottom pattern
Time frame: Daily
Observation:
The stock experienced a downward trend in January 2024, later forming a double bottom pattern on the daily chart. It broke out of this pattern in early September 2024 and has been moving upward since. If the breakout momentum holds, technical analysis suggests the stock may continue to rise further
It's advisable to look for additional confirmations, such as RSI levels and the MACD indicator.
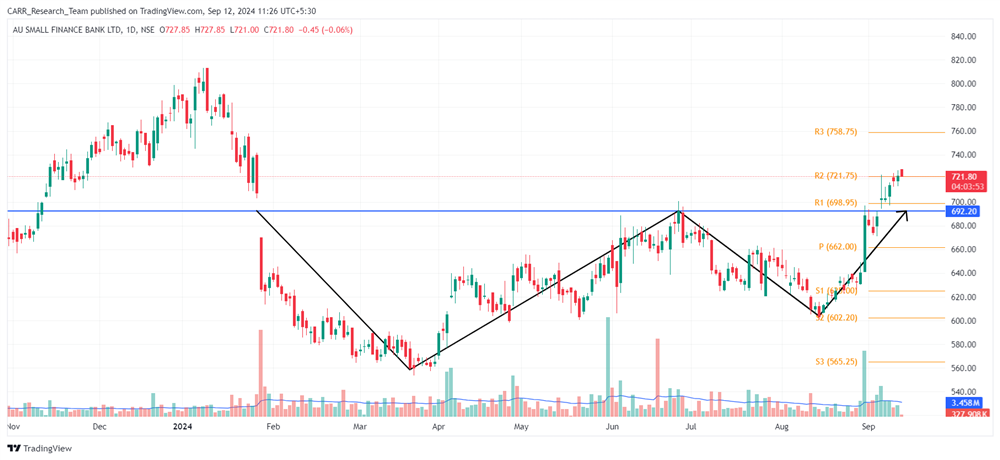
You may add this to your watch list to understand further price action.
Disclaimer: This analysis is purely for educational purpose and does not contain any recommendation. Please consult your financial advisor before taking any financial decision.

Stock name: Usha Martin Ltd.
Pattern: Parallel channel pattern
Time frame: Daily
Observation:
The stock has been trading within a parallel channel on its daily chart for an extended period. In August 2024, it touched the channel's support line and managed to stay within the pattern. After moving along the support line for a few sessions, the stock gained upward momentum, backed by substantial trading volume. According to technical analysis, if this momentum persists, the stock may see further upward movement. It's advisable to look for additional confirmations, such as RSI levels and the MACD indicator.
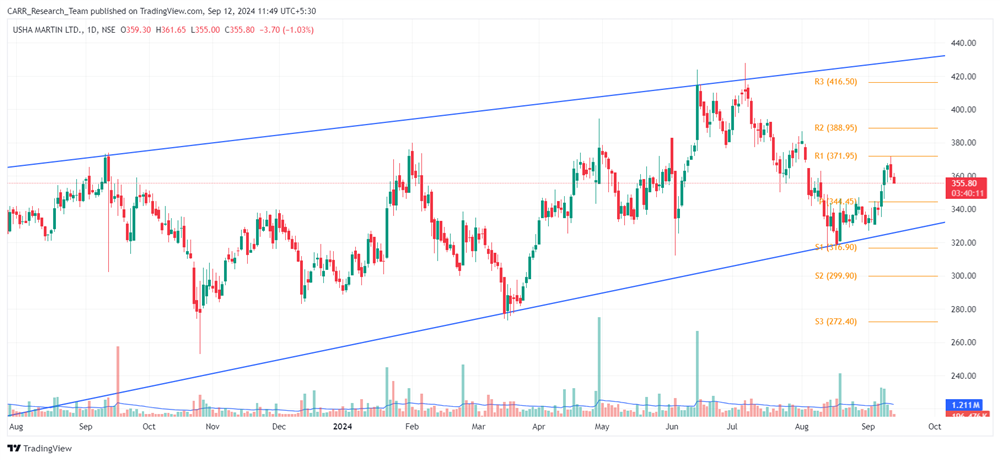
You may add this to your watch list to understand further price action.
Disclaimer: This analysis is purely for educational purpose and does not contain any recommendation. Please consult your financial advisor before taking any financial decision.


