
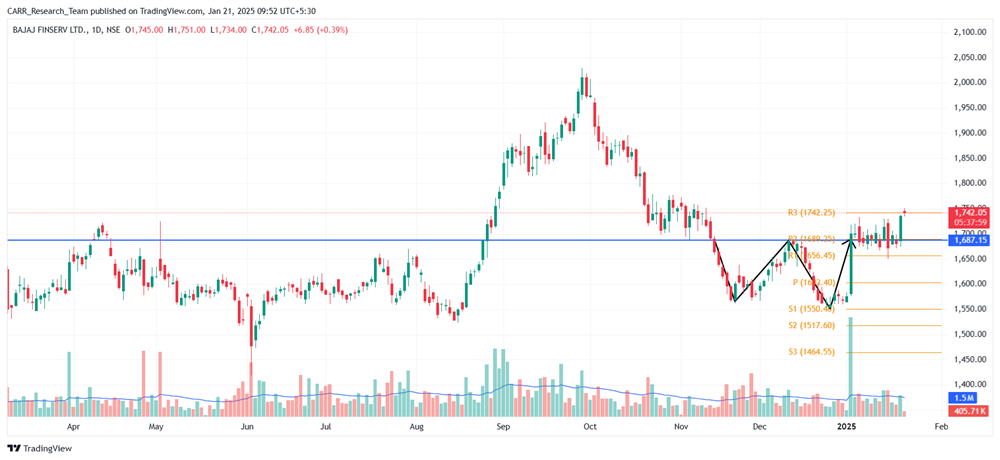
Stock name: Bajaj Finserv Ltd.
Pattern: Double bottom pattern and retest
Time frame: Daily
Observation:
The stock reached its all-time high (ATH) in late September 2024 before cooling down and moving downward. Between November 2024 and January 2025, it formed a double bottom pattern on the daily chart. On January 2, 2025, the stock broke out of the pattern with a significant upward movement and large volumes. After consolidating around this level, it posted a strong upward candle on January 20, 2025. If the stock sustains its momentum, technical analysis indicates that the stock may rise further. It's advisable to look for additional confirmations, such as RSI levels and the MACD indicator.
You may add this to your watch list to understand further price action.
Disclaimer: This analysis is purely for educational purpose and does not contain any recommendation. Please consult your financial advisor before taking any financial decision.

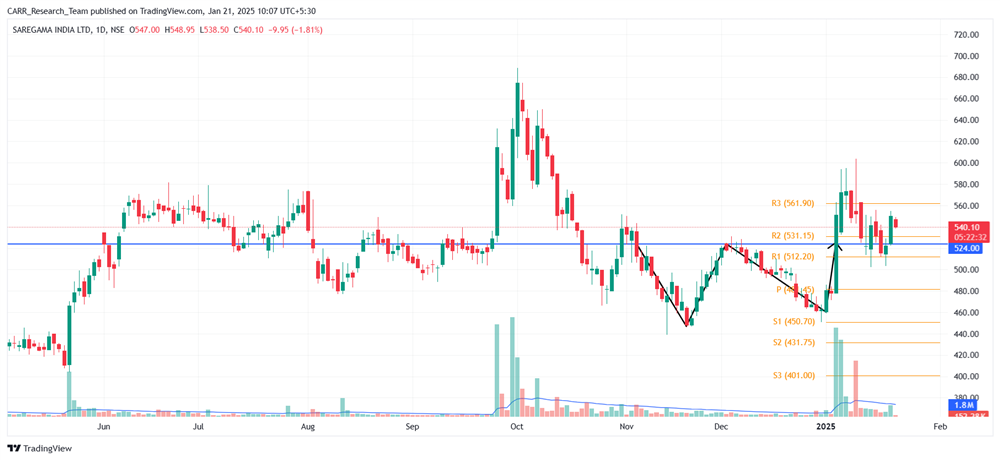
Stock name: Saregama India Ltd.
Pattern: Double bottom pattern and retest
Time frame: Daily
Observation:
After reaching its all-time high (ATH) in October 2024, the stock has cooled down before stabilizing. Between November 2024 and January 2025, it formed a double bottom pattern on the daily chart and broke out of the pattern on January 3, 2025, with significant trading volumes. A subsequent retest briefly pushed the stock below the breakout line, but it rebounded above it on January 20, 2025. If the stock maintains momentum, technical analysis suggests that the stock may see further upward movement. It's advisable to look for additional confirmations, such as RSI levels and the MACD indicator.
You may add this to your watch list to understand further price action.
Disclaimer: This analysis is purely for educational purpose and does not contain any recommendation. Please consult your financial advisor before taking any financial decision.


