
Stock name: Bayer Cropscience Ltd.
Pattern: Resistance breakout
Time frame: Weekly
Observation:
The stock reached a previous high in September 2020 and later consolidated, facing strong resistance around the 6200 level. In June 2024, it broke through this resistance with strong volume, moving upward before retesting in August. The stock rebounded from the retest with good volume, and based on technical analysis, if it maintains its current momentum, it may continue moving higher. It's advisable to look for additional confirmations, such as RSI levels and the MACD indicator.
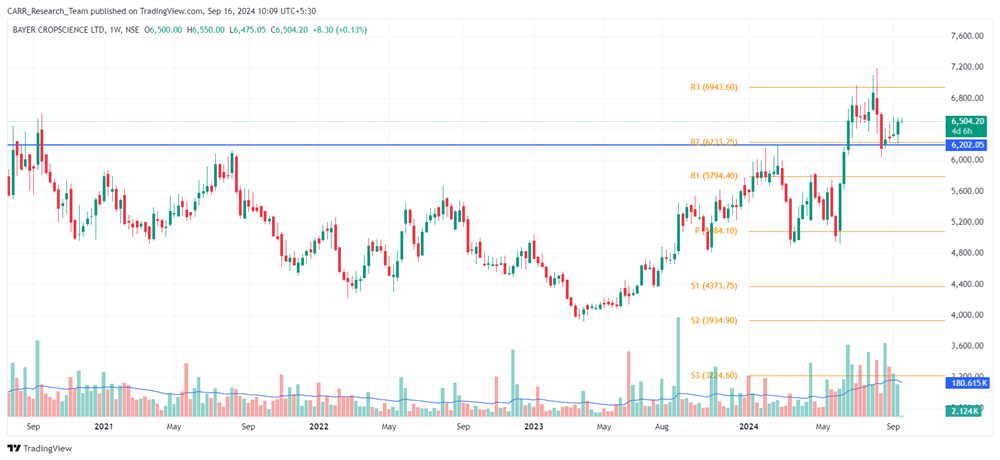
You may add this to your watch list to understand further price action.
Disclaimer: This analysis is purely for educational purpose and does not contain any recommendation. Please consult your financial advisor before taking any financial decision.

Stock name: Laxmi Organic Industries Ltd.
Pattern: Falling wedge pattern
Time frame: Weekly
Observation:
The stock had been trending downward since September 2021 and eventually formed a falling wedge pattern on its weekly chart. In August 2024, it broke out of this pattern with strong volume and an upward movement. According to technical analysis, if the stock can maintain its current momentum, it may continue to rise further. It's advisable to look for additional confirmations, such as RSI levels and the MACD indicator.
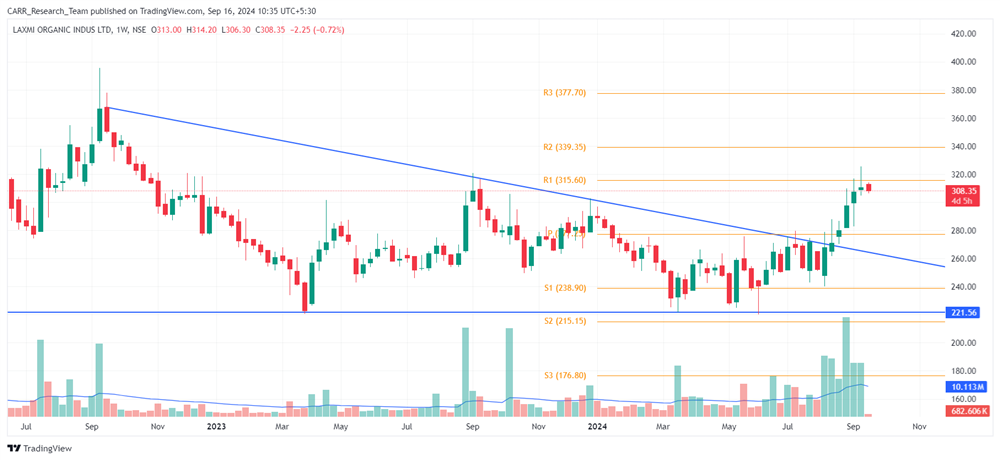
You may add this to your watch list to understand further price action.
Disclaimer: This analysis is purely for educational purpose and does not contain any recommendation. Please consult your financial advisor before taking any financial decision.


