
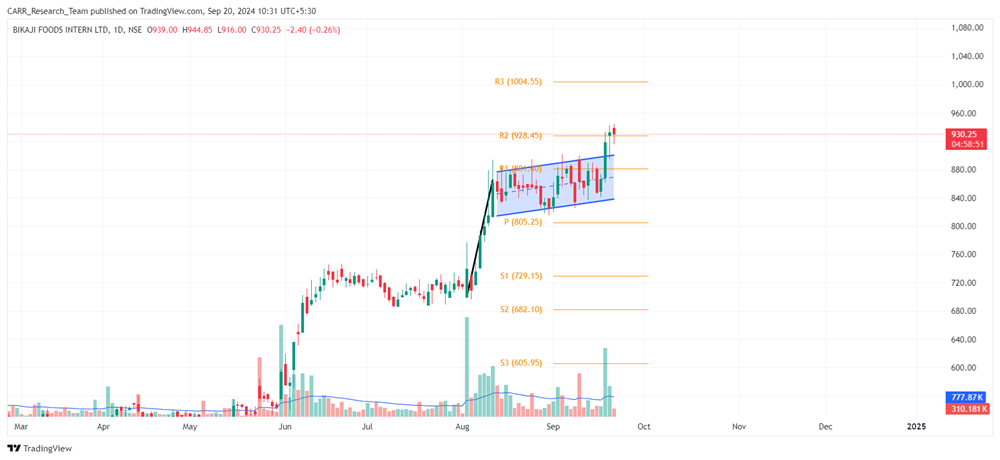
Stock name: Bikaji Foods International Ltd.
Pattern: Flag and pole pattern
Time frame: Daily
Observation:
In August 2024, the stock saw a sharp rise, followed by a consolidation phase from 13th August to 18th September, forming a flag and pole pattern on the daily chart. A breakout occurred on 18th September, supported by strong trading volume, and the stock maintained this level in the next session. Technical analysis suggests that if the stock sustains this momentum, it may move further upward. It's advisable to look for additional confirmations, such as RSI levels and the MACD indicator.
You may add this to your watch list to understand further price action.
Disclaimer: This analysis is purely for educational purpose and does not contain any recommendation. Please consult your financial advisor before taking any financial decision.

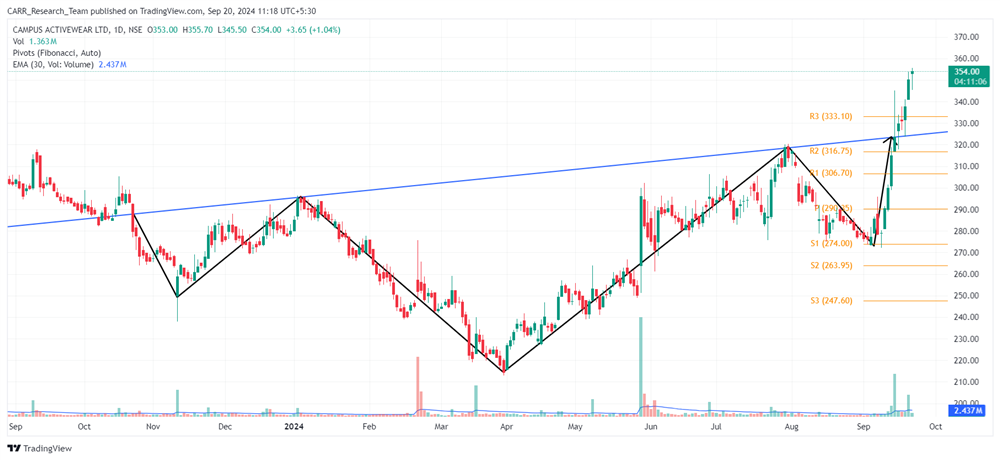
Stock name: Campus Activewear Ltd.
Pattern: Inverse head and shoulders pattern
Time frame: Daily
Observation:
The stock has been in a downward trend since October 2022 but stabilized from October 2023 to September 2024, forming an inverse head and shoulders pattern. A breakout occurred on 13th September 2024, followed by upward movement supported by strong volume on 19th September 2024. Technical analysis suggests that if the stock sustains this momentum, it may see further gains. It's advisable to look for additional confirmations, such as RSI levels and the MACD indicator.
You may add this to your watch list to understand further price action.
Disclaimer: This analysis is purely for educational purpose and does not contain any recommendation. Please consult your financial advisor before taking any financial decision.


