
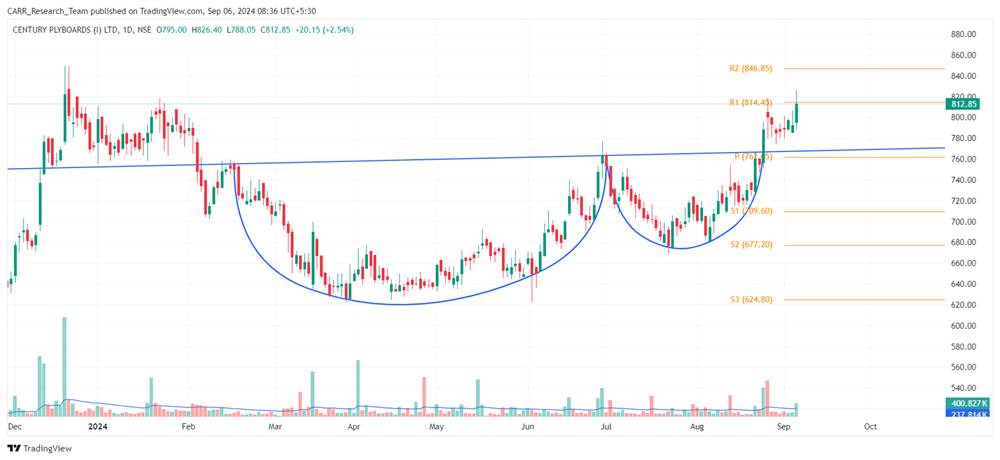
Stock name: Century Plyboards (India) Ltd.
Pattern: Cup and handle pattern
Time frame: Daily
Observation:
The stock has been on an upward trajectory since the post-Covid period. Between February 2024 and August 2024, it consolidated and formed a cup and handle pattern on its daily chart. On 26 August 2024, the stock achieved a strong breakout, supported by solid trading volumes. In the subsequent sessions, it successfully held the breakout level. According to technical analysis, if the stock can build on this breakout momentum, it may experience further upward movement. It's advisable to look for additional confirmations, such as RSI levels and the MACD indicator.
You may add this to your watch list to understand further price action.
Disclaimer: This analysis is purely for educational purpose and does not contain any recommendation. Please consult your financial advisor before taking any financial decision.

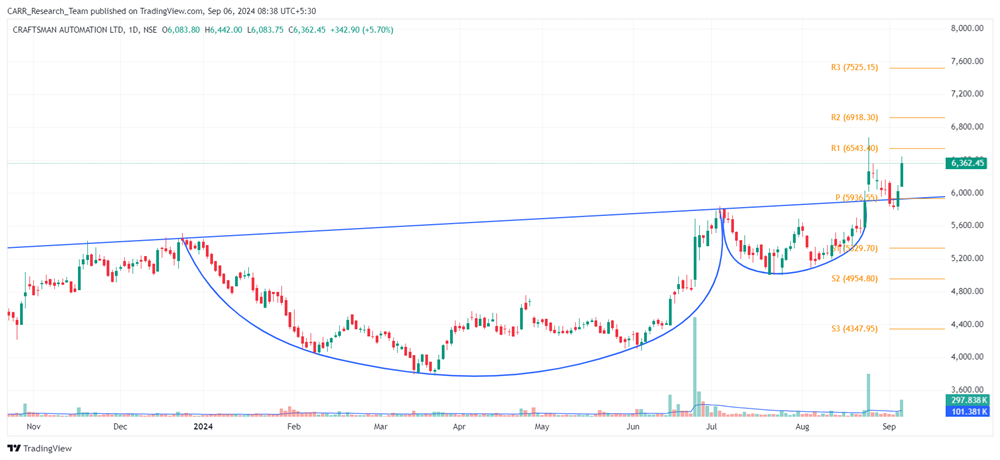
Stock name: Craftsman Automation Ltd.
Pattern: Cup and handle pattern and retest
Time frame: Daily
Observation:
The stock has been trending upward since its listing. Between December 2023 and August 2024, it formed a cup and handle pattern on the daily chart. On 26 August 2024, the stock broke out of this pattern, with the breakout candle accompanied by significant trading volume. After the breakout, the stock experienced a brief retest. Currently, the stock has rebounded successfully and resumed its upward momentum. Based on technical analysis, the stock may continue its upward movement. It's advisable to look for additional confirmations, such as RSI levels and the MACD indicator.
You may add this to your watch list to understand further price action.
Disclaimer: This analysis is purely for educational purpose and does not contain any recommendation. Please consult your financial advisor before taking any financial decision.


