
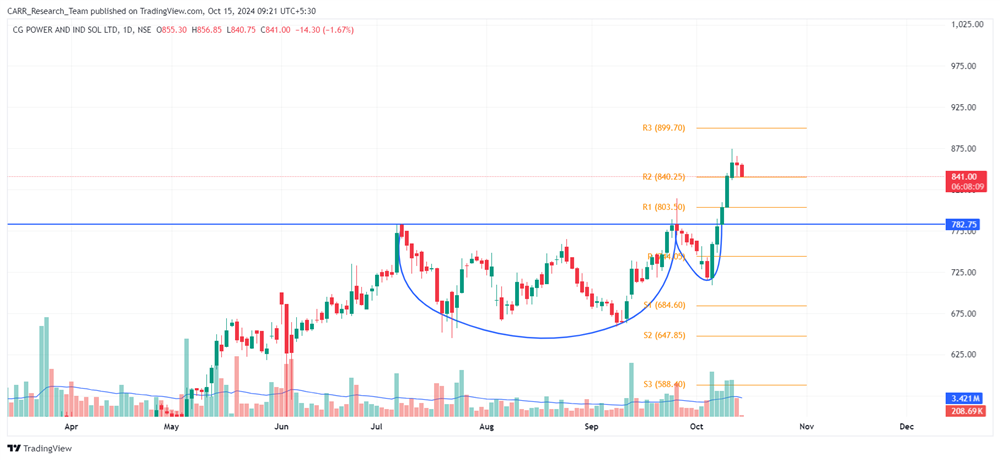
Stock name: CG Power and Industrial Solutions Ltd.
Pattern: Cup and handle pattern
Time frame: Daily
Observation:
Since the post-COVID period, the stock has experienced a steady upward trend. Between July and October 2024, it formed a cup and handle pattern on the daily chart. Following a strong momentum from October 7 onwards, the stock has registered a breakout. This breakout is supported by high trading volumes and post breakout the stock's upward momentum has continued. If this trend persists, technical analysis suggests that the stock may see further gains. It's advisable to look for additional confirmations, such as RSI levels and the MACD indicator.
You may add this to your watch list to understand further price action.
Disclaimer: This analysis is purely for educational purpose and does not contain any recommendation. Please consult your financial advisor before taking any financial decision.

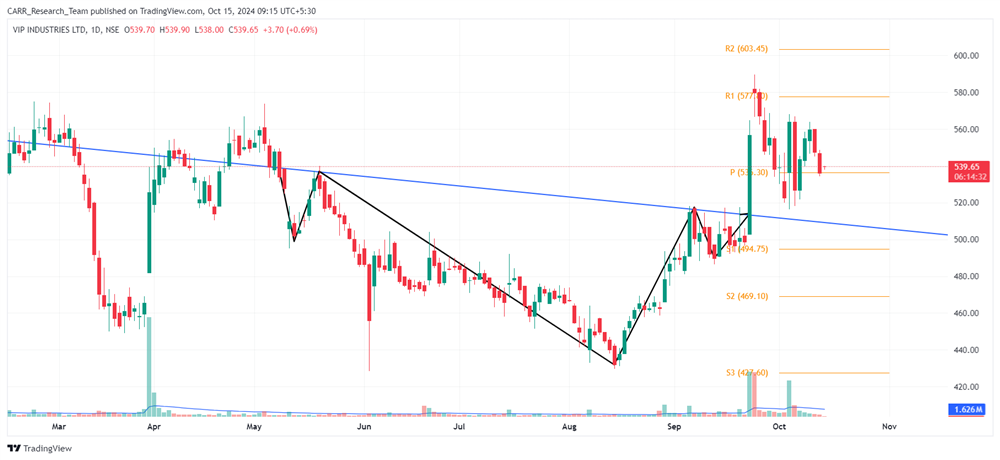
Stock name: V.I.P. Industries Ltd.
Pattern: Inverse head and shoulders pattern and retest
Time frame: Daily
Observation:
The stock had been in a downward trend since 2022 but showed some stabilization between May and September 2024, forming an inverse head and shoulders pattern on the daily chart. On September 23, 2024, the stock saw a major breakout with strong trading volume, but it faced an immediate retest afterward. Currently trading above the breakout level, technical analysis suggests that a strong rebound with good momentum is needed to confirm and sustain the breakout. It's advisable to look for additional confirmations, such as RSI levels and the MACD indicator.
You may add this to your watch list to understand further price action.
Disclaimer: This analysis is purely for educational purpose and does not contain any recommendation. Please consult your financial advisor before taking any financial decision.


