
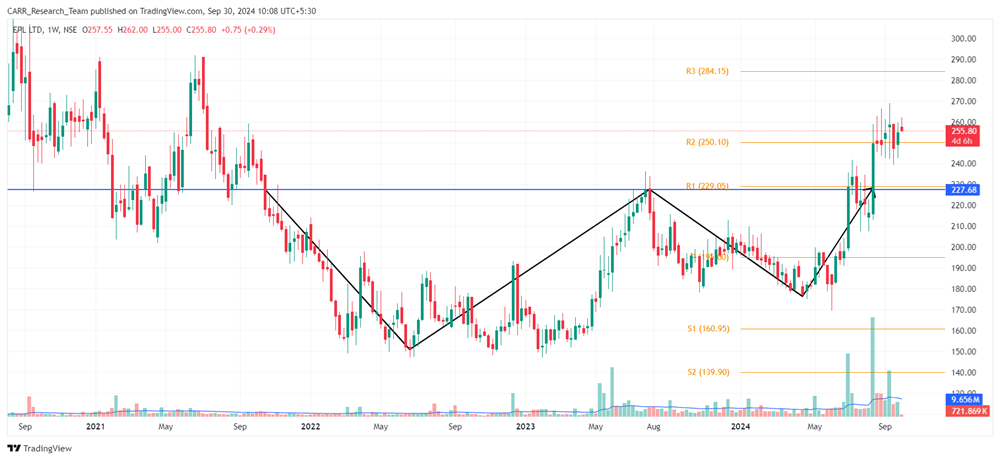
Stock name: EPL Ltd.
Pattern: Double bottom pattern
Time frame: Weekly
Observation:
The stock had been in a downward trend since August 2020 before stabilizing and forming a double bottom pattern on its weekly chart. In August 2024, it broke out of this pattern with solid volume, showing slight upward movement but facing resistance. The stock still needs a strong breakout to overcome this resistance. According to technical analysis, if the stock can maintain upward momentum, it may experience further gains. It's advisable to look for additional confirmations, such as RSI levels and the MACD indicator.
You may add this to your watch list to understand further price action.
Disclaimer: This analysis is purely for educational purpose and does not contain any recommendation. Please consult your financial advisor before taking any financial decision.

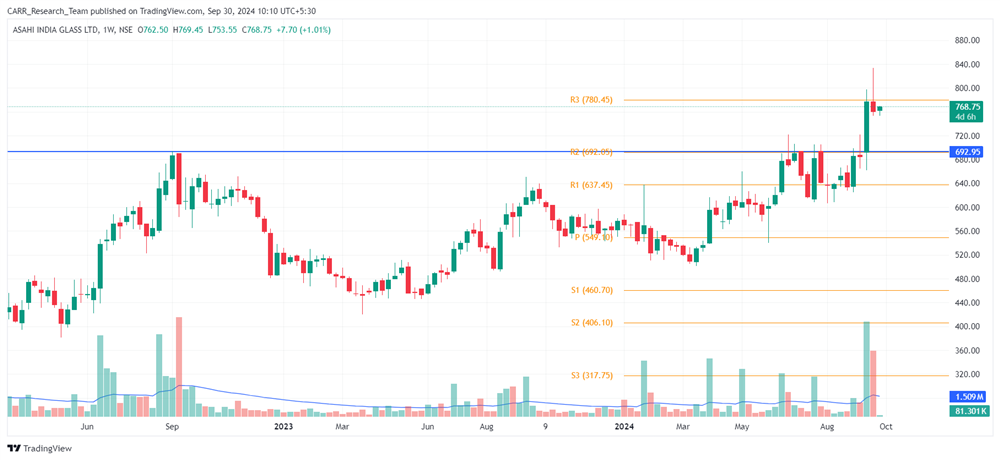
Stock name: Asahi India Glass Ltd.
Pattern: Resistance breakout
Time frame: Weekly
Observation:
The stock experienced a strong upward trend but entered a consolidation phase starting September 2022, facing resistance around the 690-700 levels. In September 2024, it broke through this resistance with significant volume, and the breakout was sustained in the following session. Based on technical analysis, if the stock continues this momentum, it may move further upward. It's advisable to look for additional confirmations, such as RSI levels and the MACD indicator.
You may add this to your watch list to understand further price action.
Disclaimer: This analysis is purely for educational purpose and does not contain any recommendation. Please consult your financial advisor before taking any financial decision.


