
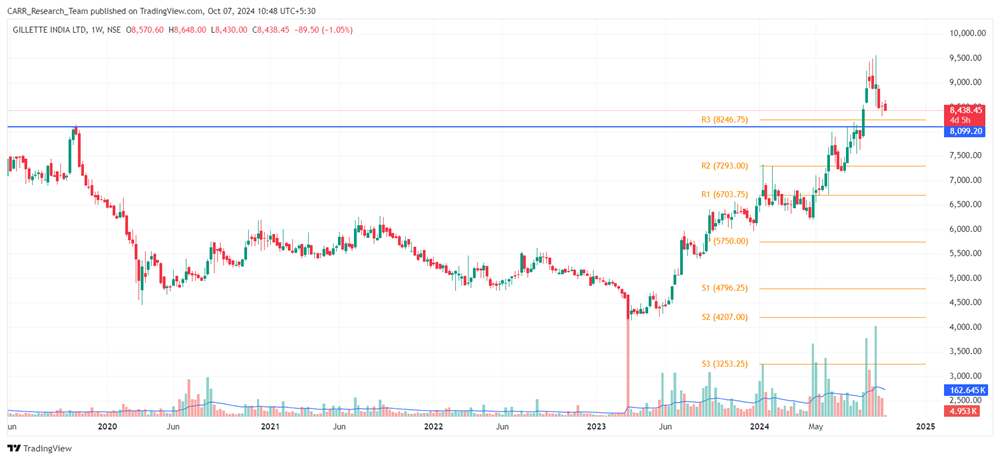
Stock name: Gillette India Ltd.
Pattern: Resistance breakout and retest
Time frame: Weekly
Observation:
The stock reached its previous all-time high (ATH) in 2019 but experienced a downward trend afterward. Recovery began in March 2023, though it encountered resistance around the 8100 level, near its previous ATH. In August 2024, the stock broke through this resistance, followed by an upward move with significant trading volume. Currently, it is undergoing a retest with lower volume, in line with overall market conditions. Technical analysis suggests that if the stock rebounds with strong momentum, the stock may see further improvement. It's advisable to look for additional confirmations, such as RSI levels and the MACD indicator.
You may add this to your watch list to understand further price action.
Disclaimer: This analysis is purely for educational purpose and does not contain any recommendation. Please consult your financial advisor before taking any financial decision.

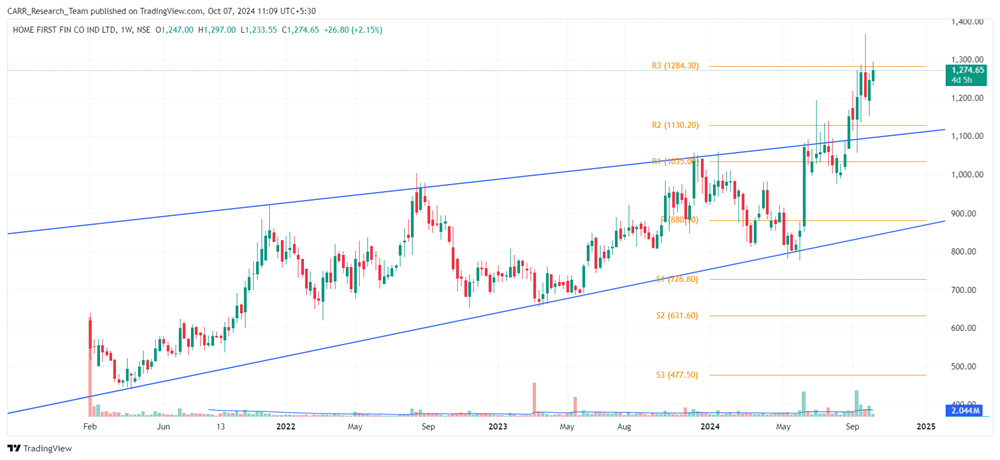
Stock name: Home First Finance Company India Ltd.
Pattern: Resistance breakout
Time frame: Weekly
Observation:
Since its listing in 2021, the stock has been trading within a parallel channel. Towards the end of August 2024, it broke out of this pattern, followed by an upward movement supported by strong trading volume. According to technical analysis, if the stock maintains its breakout momentum, it may see further rise. It's advisable to look for additional confirmations, such as RSI levels and the MACD indicator.
You may add this to your watch list to understand further price action.
Disclaimer: This analysis is purely for educational purpose and does not contain any recommendation. Please consult your financial advisor before taking any financial decision.


