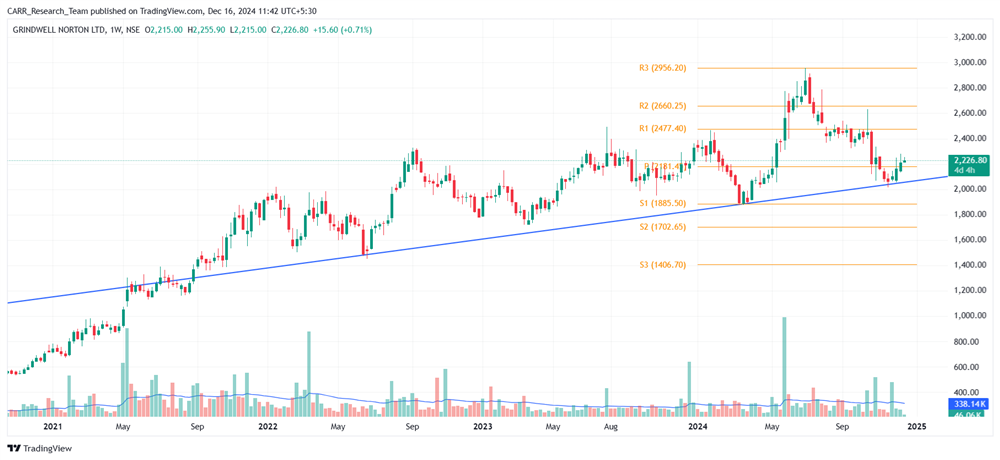
Stock name: Grindwell Norton Ltd.
Pattern: Support and reversal
Time frame: Weekly
Observation:
The stock has maintained an overall uptrend, forming an inclined support line on the weekly chart from August 2021 to December 2024. It has repeatedly rebounded from this support, most recently in late November 2024, after cooling off from its ATH since July 2024. This rebound, supported by strong trading volume, has led to an upward movement. According to technical analysis, if the current momentum sustains, the stock may witness further upward progress. It's advisable to look for additional confirmations, such as RSI levels and the MACD indicator.

You may add this to your watch list to understand further price action.
Disclaimer: This analysis is purely for educational purpose and does not contain any recommendation. Please consult your financial advisor before taking any financial decision

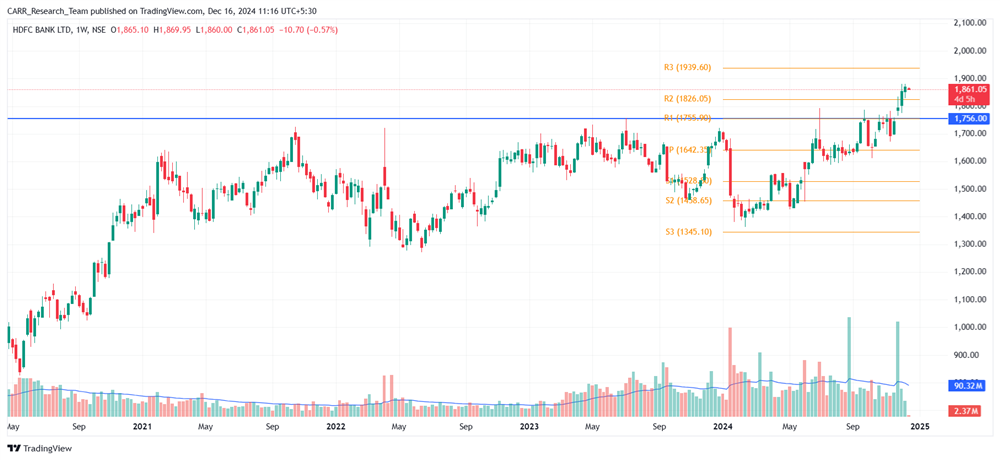
Stock name: HDFC Bank Ltd.
Pattern: Resistance breakout
Time frame: Weekly
Observation:
Post-COVID, the stock saw a swift recovery, reaching its peak by October 2021. Since then, it has traded sideways, forming a resistance near its ATH, with multiple unsuccessful breakout attempts. Even though the stock has breached the highs of October 2021 there was no significant upward movement. However, in late November 2024, the stock finally broke out of this pattern with strong volumes, marking a decisive upward move. Currently at its highest price, technical analysis suggests that sustained momentum could lead to further gains. It's advisable to look for additional confirmations, such as RSI levels and the MACD indicator.

You may add this to your watch list to understand further price action.
Disclaimer: This analysis is purely for educational purpose and does not contain any recommendation. Please consult your financial advisor before taking any financial decision.


