
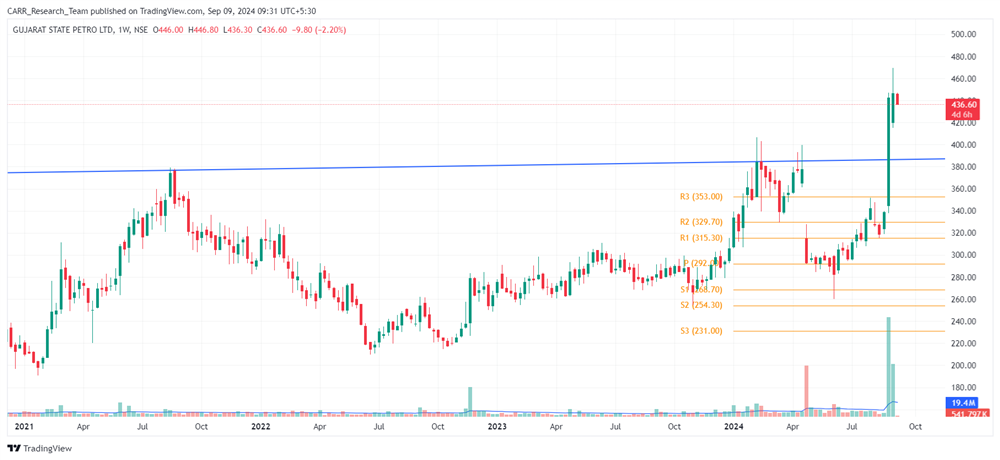
Stock name: Gujarat State Petronet Ltd.
Pattern: Resistance breakout
Time frame: Weekly
Observation:
The stock has faced strong resistance around the 380 level since August 2021. Between February and April 2024, it attempted to breach this resistance but failed, strengthening it further. However, towards the end of August 2024, the stock successfully broke through with high trading volume, and the following week's candle confirmed the breakout. According to technical analysis, the stock may continue moving upward if it maintains this momentum. It's advisable to look for additional confirmations, such as RSI levels and the MACD indicator.
You may add this to your watch list to understand further price action.
Disclaimer: This analysis is purely for educational purpose and does not contain any recommendation. Please consult your financial advisor before taking any financial decision.

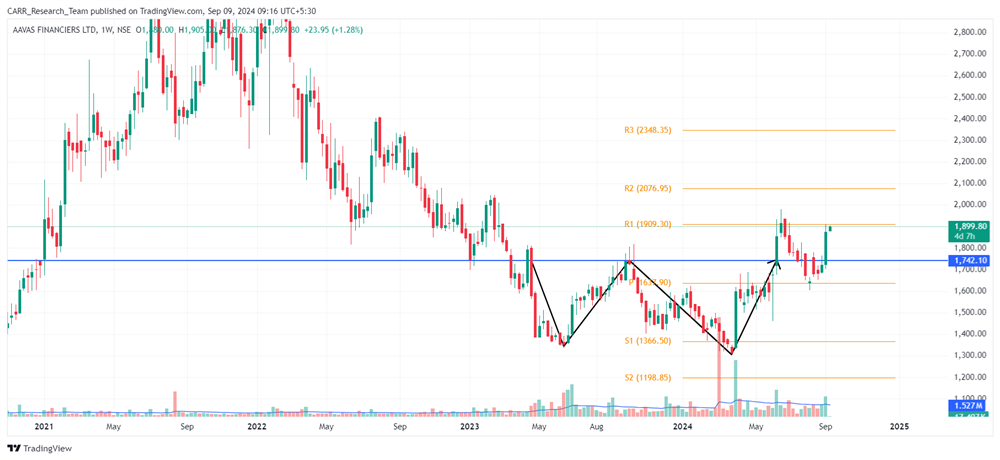
Stock name: Aavas Financiers Ltd.
Pattern: Double bottom pattern and retest
Time frame: Weekly
Observation:
The stock experienced a downward trend starting in January 2022. Between April 2023 and June 2024, it formed a double bottom pattern on the weekly chart, followed by a breakout in June 2024. After an initial upward move, the stock retested the breakout level immediately. In the month of September, the stock has rebounded with strong volumes. If the current momentum holds, the stock may see further upward movement according to technical analysis. It's advisable to look for additional confirmations, such as RSI levels and the MACD indicator.
You may add this to your watch list to understand further price action.
Disclaimer: This analysis is purely for educational purpose and does not contain any recommendation. Please consult your financial advisor before taking any financial decision.


