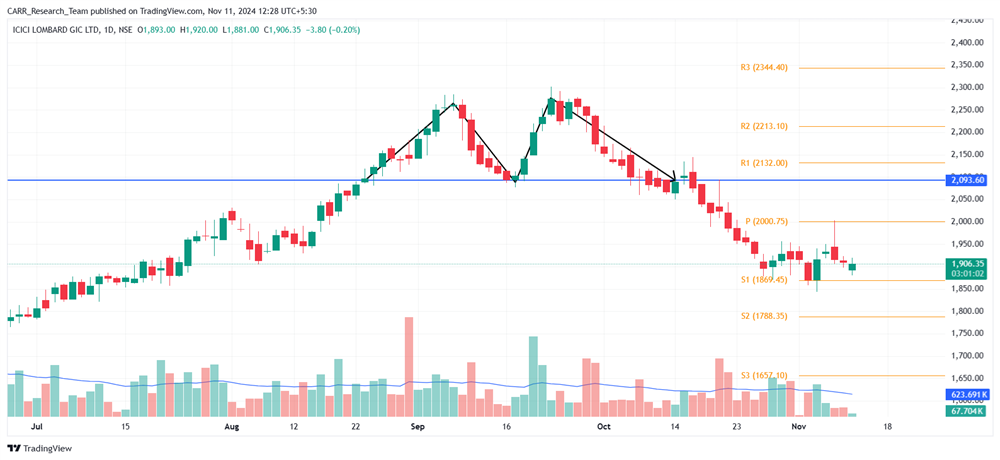
Stock name: ICICI Lombard General Insurance Company Ltd.
Pattern: Double top pattern
Time frame: Daily
Observation:
In the previous blog on October 22, 2024 (link for reference), we noted a double top pattern forming in the stock's daily chart. Following its breakdown, the stock declined steadily until November 5, meeting the pattern's target. Since then, it has been consolidating around these levels, showing signs of stability. Top of FormBottom of FormBottom of Form

You may add this to your watch list to understand further price action.
Disclaimer: This analysis is purely for educational purpose and does not contain any recommendation. Please consult your financial advisor before taking any financial decision.
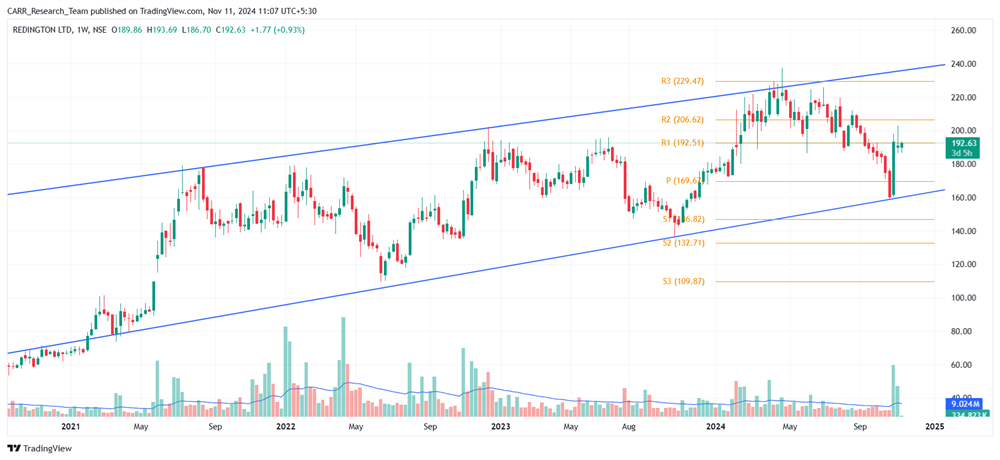
Stock name: Redington Ltd.
Pattern: Parallel channel pattern
Time frame: Weekly
Observation:
The stock has been trading within a parallel channel for an extended period, establishing clear support and resistance levels. Since April 2024, it experienced a downward trend, eventually hitting the support level of the channel. After reaching this support, the stock rebounded strongly, accompanied by high trading volume, with a subsequent green candle confirming the recovery. According to technical analysis, if this momentum continues, further upward movement may be anticipated. It's advisable to look for additional confirmations, such as RSI levels and the MACD indicator.

You may add this to your watch list to understand further price action.
Disclaimer: This analysis is purely for educational purpose and does not contain any recommendation. Please consult your financial advisor before taking any financial decision.


