
Stock name: ICICI Lombard General Insurance Company Ltd.
Pattern: Double top pattern
Time frame: Daily
Observation:
The stock has been moving upward since June 2024 but formed a double top pattern between August and October 2024. It experienced a breakdown around October 16-17, 2024, and has been declining since. A large-volume downward candle on October 21, 2024, signals continued bearish momentum. According to technical analysis, this momentum suggests the stock may face further declines. Bottom of Form
It's advisable to look for additional confirmations, such as RSI levels and the MACD indicator.
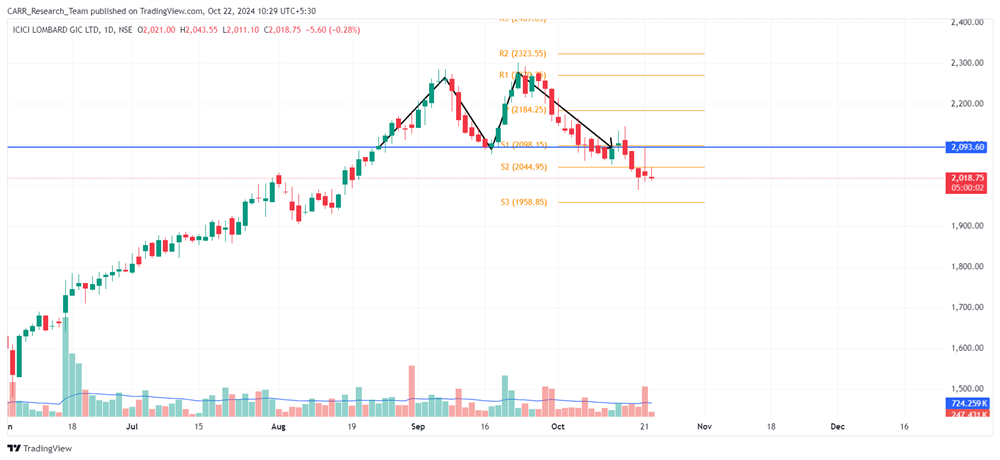
You may add this to your watch list to understand further price action.
Disclaimer: This analysis is purely for educational purpose and does not contain any recommendation. Please consult your financial advisor before taking any financial decision.

Stock name: Bajaj Auto Ltd.
Pattern: Support and rebound
Time frame: Daily
Observation:
The stock reached its previous all-time high (ATH) in June 2024, forming a resistance line at that level. After several attempts, it broke through this resistance in August 2024, leading to a strong upward move until late September. Following this, the stock declined in line with the broader market's bearish sentiment. On October 21, 2024, it found support at the former resistance level and rebounded with strong volume, forming a morning star pattern. According to technical analysis, if the stock sustains this rebound momentum, it may see further upward movement. It's advisable to look for additional confirmations, such as RSI levels and the MACD indicator.
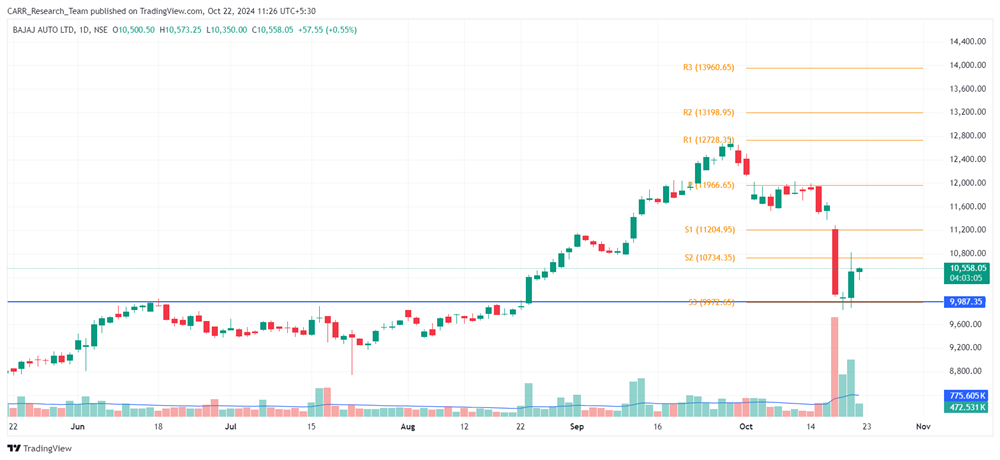
You may add this to your watch list to understand further price action.
Disclaimer: This analysis is purely for educational purpose and does not contain any recommendation. Please consult your financial advisor before taking any financial decision.


