
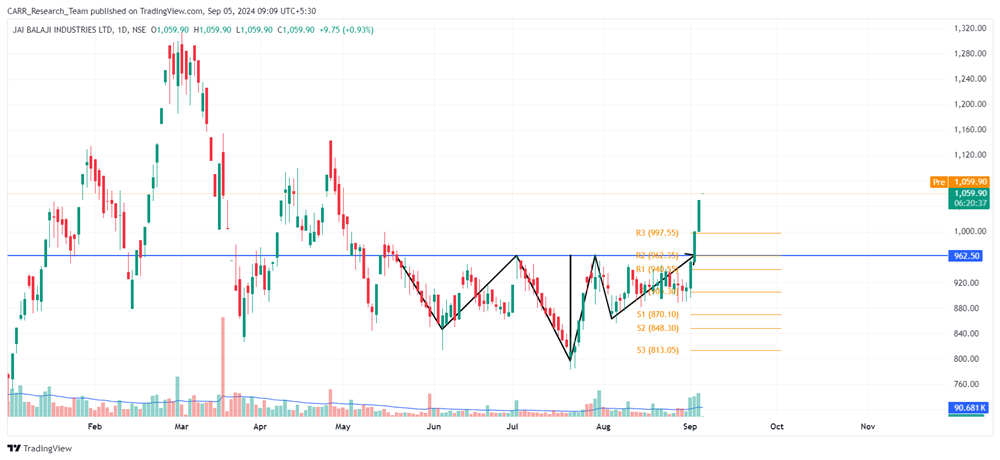
Stock name: Jai Balaji Industries Ltd.
Pattern: Inverse head and shoulders pattern
Time frame: Daily
Observation:
The stock has been on a downward trend since March 2024. Between May 2024 and September 2024, it stabilized and formed an inverse head and shoulders pattern on its daily chart. On September 3, 2024, the stock broke out of this pattern, followed by strong upward momentum in the next trading session. According to technical analysis, if the current momentum continues, the stock may experience further gains. It's advisable to look for additional confirmations, such as RSI levels and the MACD indicator.
You may add this to your watch list to understand further price action.
Disclaimer: This analysis is purely for educational purpose and does not contain any recommendation. Please consult your financial advisor before taking any financial decision.

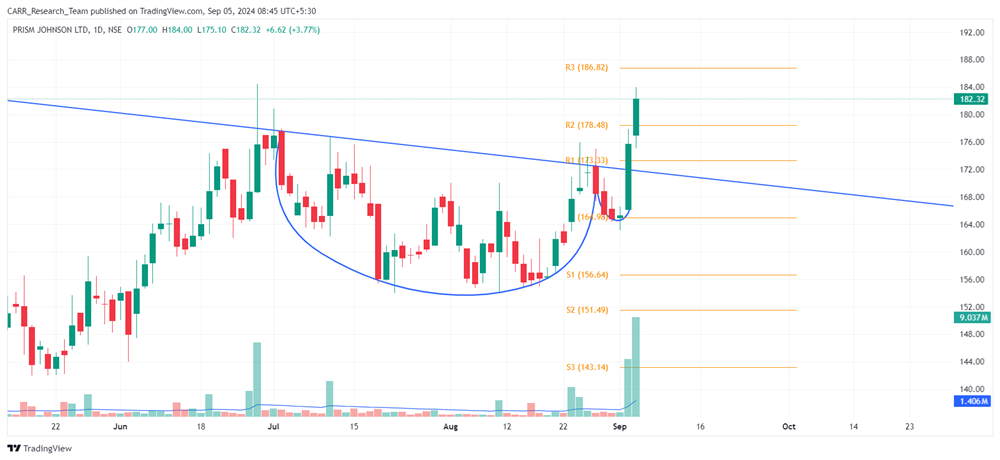
Stock name: Prism Johnson Ltd.
Pattern: Cup and handle pattern
Time frame: Daily
Observation:
Since the post-COVID period, the overall trend for the stock has been positive. Recently, it consolidated and formed a cup and handle pattern on its daily chart between July 2024 and September 2024. On September 3, 2024, the stock broke out of this pattern, supported by substantial trading volume. In the following session, the upward movement continued with even greater volume. According to technical analysis, if the stock sustains its breakout momentum, it may see further upward movement. It's advisable to look for additional confirmations, such as RSI levels and the MACD indicator.
You may add this to your watch list to understand further price action.
Disclaimer: This analysis is purely for educational purpose and does not contain any recommendation. Please consult your financial advisor before taking any financial decision.


