
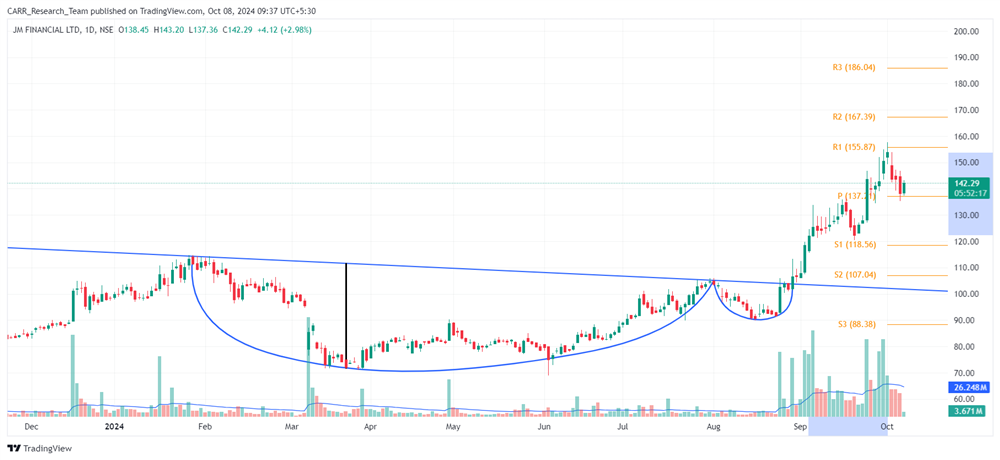
Stock name: JM Financial Ltd.
Pattern: Cup and handle pattern
Time frame: Daily
Observation:
According to the blog from September 4, 2024, the stock formed a cup and handle pattern on its daily chart, breaking out at the end of August. Post-breakout, it saw significant upward momentum supported by strong trading volumes. From September 4 to October 1, 2024, the stock surged over 25%.
You may add this to your watch list to understand further price action.
Disclaimer: This analysis is purely for educational purpose and does not contain any recommendation. Please consult your financial advisor before taking any financial decision.

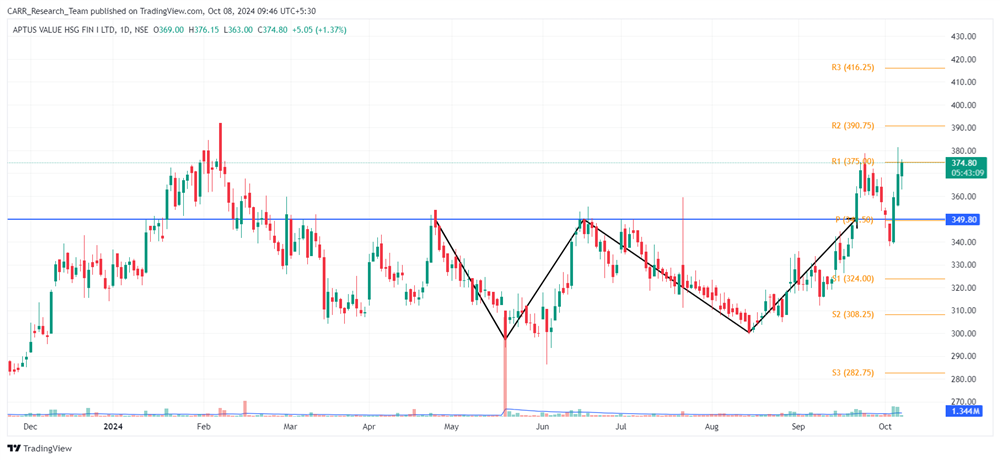
Stock name: Aptus Value Housing Finance India Ltd.
Pattern: Double bottom pattern and retest
Time frame: Daily
Observation:
As mentioned in the blog on September 26, 2024, the stock formed a double bottom pattern on its daily chart, breaking out on September 20 with strong trading volume. However, due to overall bearish market sentiment, it retraced and retested the breakout level. The stock has since rebounded with significant volume, and technical analysis suggests that if it maintains this momentum, the stock may see further upward movement. Additionally, the stock has repeatedly encountered resistance at its all-time high (ATH), making this level critical for its future performance. It's advisable to look for additional confirmations, such as RSI levels and the MACD indicator.
You may add this to your watch list to understand further price action.
Disclaimer: This analysis is purely for educational purpose and does not contain any recommendation. Please consult your financial advisor before taking any financial decision.


