
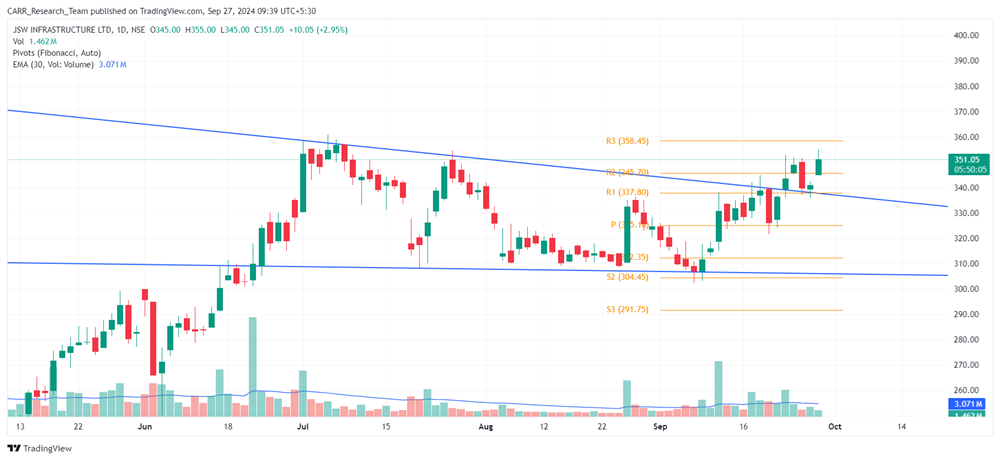
Stock name: JSW Infrastructure Ltd.
Pattern: Falling wedge pattern
Time frame: Daily
Observation:
After reaching an all-time high (ATH), the stock formed a falling wedge pattern on the daily chart from July to September 2024. A breakout occurred on September 23, 2024, supported by strong volume. In the following trading sessions, the stock has maintained its upward momentum. If it continues to hold this momentum, technical analysis suggests that the stock may see further upward movement. It's advisable to look for additional confirmations, such as RSI levels and the MACD indicator.
You may add this to your watch list to understand further price action.
Disclaimer: This analysis is purely for educational purpose and does not contain any recommendation. Please consult your financial advisor before taking any financial decision.

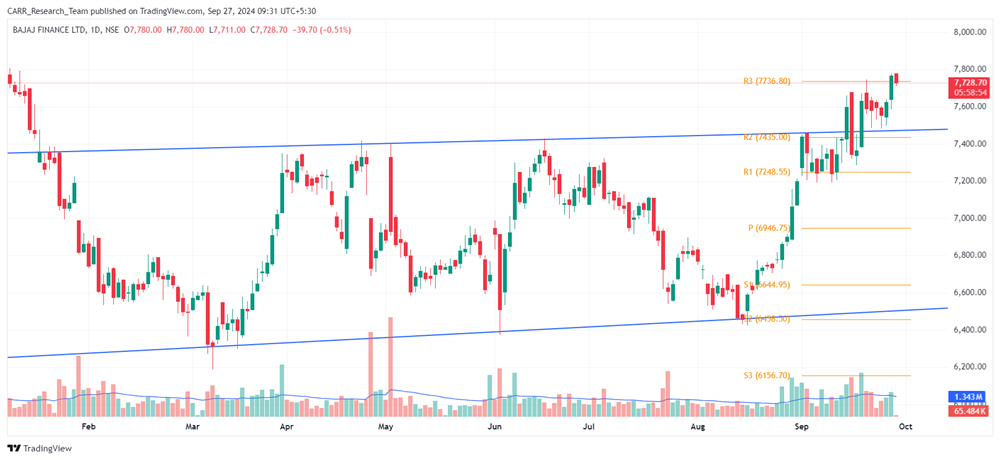
Stock name: Bajaj Finance Ltd.
Pattern: Resistance breakout
Time frame: Daily
Observation:
The stock underwent a prolonged consolidation, moving within a parallel channel from January to September 2024. On September 18, 2024, it broke out of the channel with strong volume. After a brief retest of the breakout level, the stock quickly rebounded. If the current momentum holds, technical analysis suggests that the stock may move further upwards. It's advisable to look for additional confirmations, such as RSI levels and the MACD indicator.
You may add this to your watch list to understand further price action.
Disclaimer: This analysis is purely for educational purpose and does not contain any recommendation. Please consult your financial advisor before taking any financial decision.


