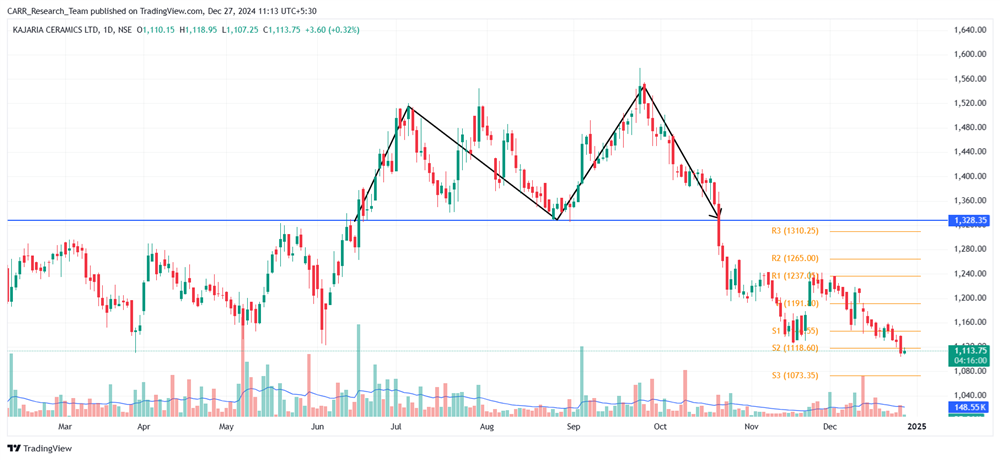
Stock name: Kajaria Ceramics Ltd.
Pattern: Double top pattern
Time frame: Daily
Observation:
In our blog on October 29, 2024 (link for reference), we noted that the stock had formed a double top pattern on its daily chart. It broke down from this pattern on October 22, 2024, and has since continued its decline with strong volumes. Aligning with the broader market trend, the stock has witnessed significant drops from the levels seen on October 22.

You may add this to your watch list to understand further price action.
Disclaimer: This analysis is purely for educational purpose and does not contain any recommendation. Please consult your financial advisor before taking any financial decision.
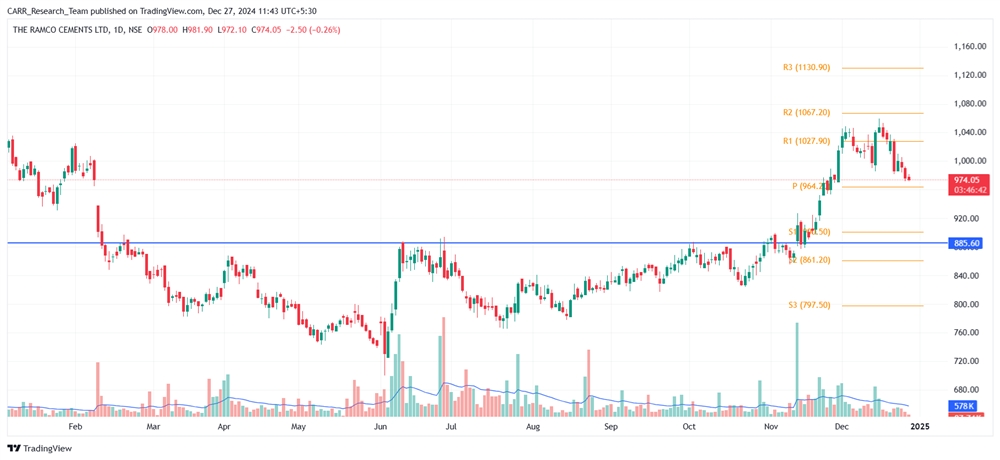
Stock name: The Ramco Cements Ltd.
Pattern: Resistance breakout
Time frame: Daily
Observation:
As mentioned in our previous blog on November 21, 2024 (link for reference), the stock had formed a resistance line on its daily chart. It broke out of that level, followed by a successful retest, leading to a strong upward movement. This rally propelled the stock to its previous high before experiencing a minor correction. This level might act as a resistance level for the stock. It's advisable to look for additional confirmations, such as RSI levels and the MACD indicator.

You may add this to your watch list to understand further price action.
Disclaimer: This analysis is purely for educational purpose and does not contain any recommendation. Please consult your financial advisor before taking any financial decision.


