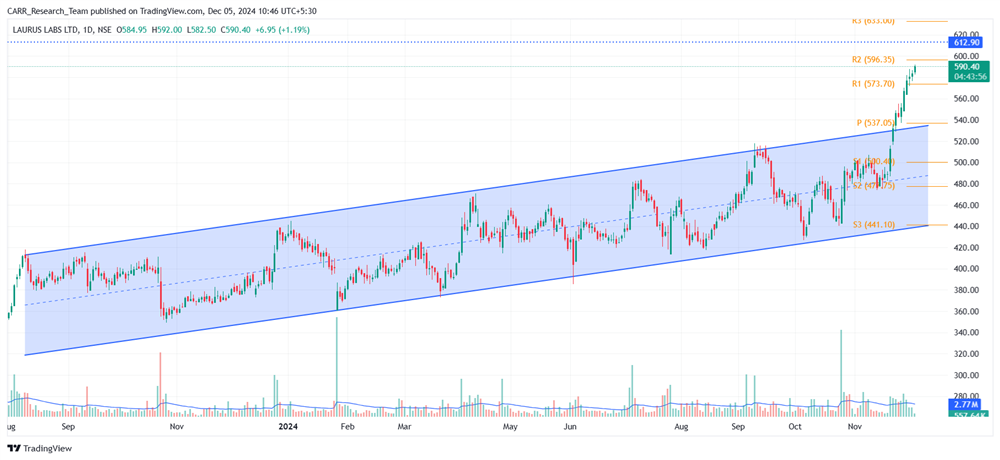
Stock name: Laurus Labs Ltd.
Pattern: Parallel channel and breakout
Time frame: Daily
Observation:
In our 10 October 2024 blog (link for reference), we highlighted a stock trading within a parallel channel for an extended period. Around 08 October 2024, it rebounded from the channel's support and started moving upward. On 25 November 2024, the stock broke through the resistance level of the channel, continuing its bullish momentum. It is now nearing a crucial resistance level at a prior high on the daily chart, where a breakout may signal further upward movement. It's advisable to look for additional confirmations, such as RSI levels and the MACD indicator.

You may add this to your watch list to understand further price action.
Disclaimer: This analysis is purely for educational purpose and does not contain any recommendation. Please consult your financial advisor before taking any financial decision.
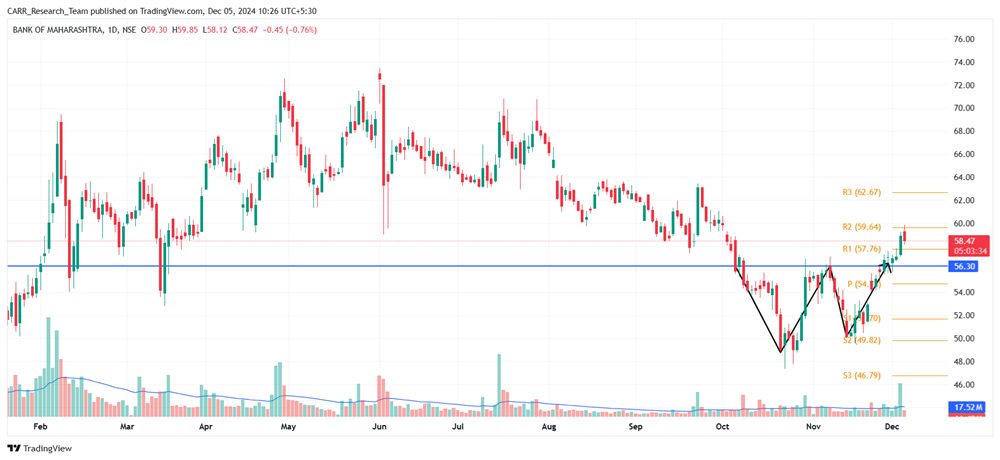
Stock name: Bank of Maharashtra
Pattern: Double bottom pattern
Time frame: Daily
Observation:
The stock reached a high in early June 2024 but subsequently cooled off. Between October and November 2024, it formed a double-bottom pattern on the daily chart. Towards the end of November 2024, the stock broke out of this pattern, confirmed by subsequent green candles. A big green candle with significant volume is observed on 04 December 2024. According to technical analysis, if the stock sustains its breakout momentum, it may witness further upside. It's advisable to look for additional confirmations, such as RSI levels and the MACD indicator.

You may add this to your watch list to understand further price action.
Disclaimer: This analysis is purely for educational purpose and does not contain any recommendation. Please consult your financial advisor before taking any financial decision.


