
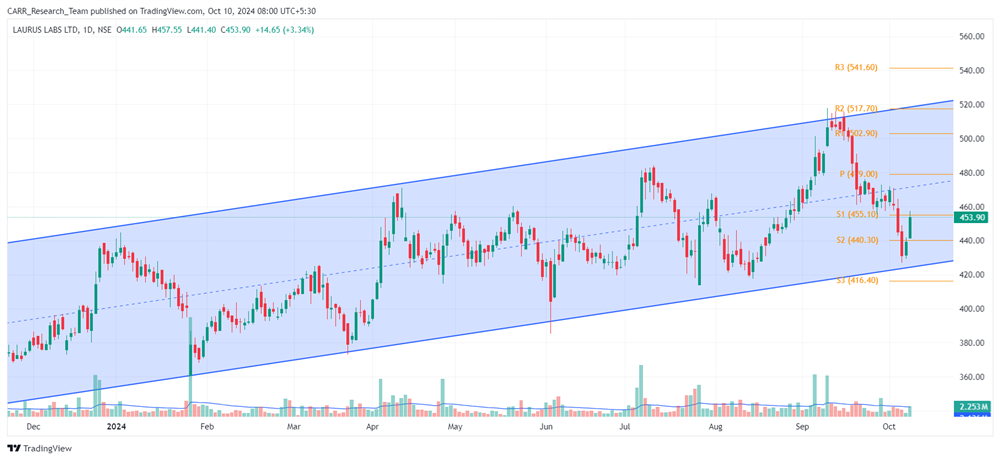
Stock name: Laurus Labs Ltd.
Pattern: Parallel channel
Time frame: Daily
Observation:
Since April 2023, the stock has been moving upward in a parallel channel. It hit resistance on 16th September 2024 and then moved downward, approaching the channel's support. On 8th October 2024, the stock formed a bullish harami candlestick pattern at the support level of the parallel channel, followed by another green candle the next day, confirming the reversal. If the current momentum holds, the stock may see further upward movement within the channel, according to technical analysis. It's advisable to look for additional confirmations, such as RSI levels and the MACD indicator.
You may add this to your watch list to understand further price action.
Disclaimer: This analysis is purely for educational purpose and does not contain any recommendation. Please consult your financial advisor before taking any financial decision.

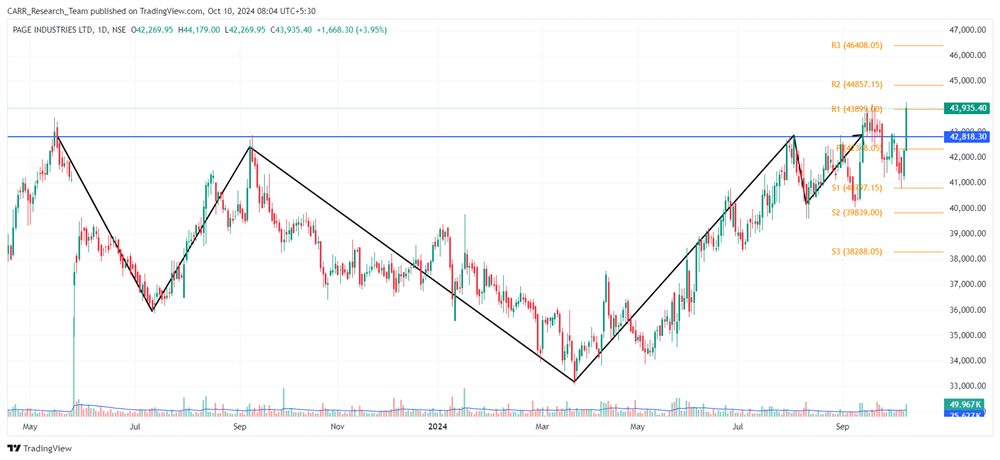
Stock name: Page Industries Ltd.
Pattern: Inverse head and shoulders pattern and retest
Time frame: Daily
Observation:
The stock has been in a downward trend since October 2022. From March 2023 to September 2024, it formed an inverse head and shoulders pattern on the daily chart, breaking out around 11-12 September 2024 with strong volume. After a retest and closing below the breakout line due to market bearishness, the stock rebounded and closed above the breakout line on 9th October 2024 with high volume. If the momentum holds, the stock may see further upward movement based on technical analysis. It's advisable to look for additional confirmations, such as RSI levels and the MACD indicator.
You may add this to your watch list to understand further price action.
Disclaimer: This analysis is purely for educational purpose and does not contain any recommendation. Please consult your financial advisor before taking any financial decision.


