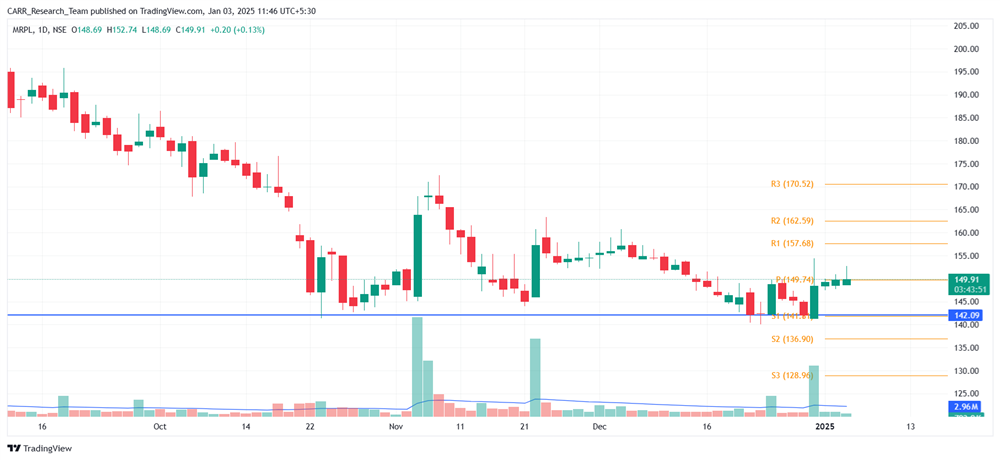
Stock name: Mangalore Refinery & Petrochemicals Ltd.
Pattern: Support and reversal
Time frame: Daily
Observation:
The stock experienced a downtrend from February to October 2024, followed by stabilization and consolidation, leading to the formation of a strong support line. Multiple rebounds from this level highlight its significance, with the latest on December 31, 2024, showing a good recovery accompanied by high volumes. This suggests renewed buying interest and, if the stock maintains its momentum, technical analysis indicates that the stock may see further upside. It's advisable to look for additional confirmations, such as RSI levels and the MACD indicator.

You may add this to your watch list to understand further price action.
Disclaimer: This analysis is purely for educational purpose and does not contain any recommendation. Please consult your financial advisor before taking any financial decision.
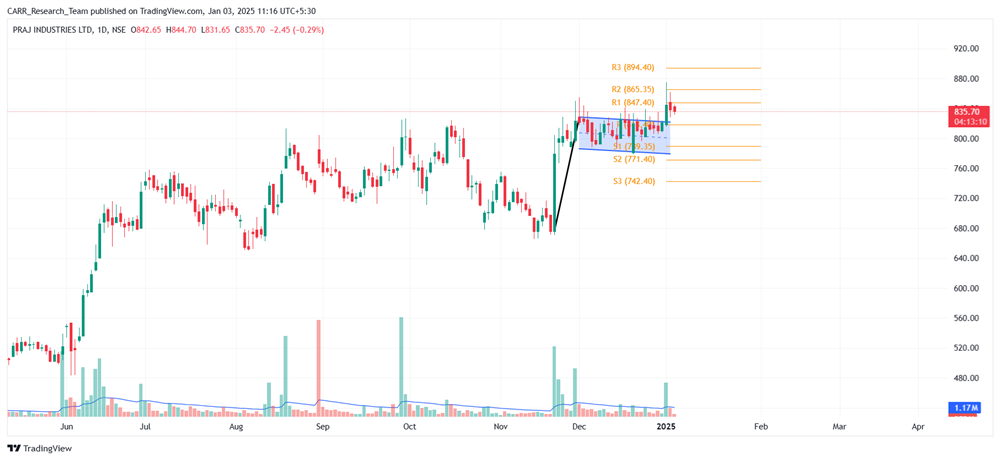
Stock name: Praj Industries Ltd.
Pattern: Flag and pole pattern
Time frame: Daily
Observation:
The stock experienced a sharp upward move in the second half of November 2024, followed by consolidation in December, forming a flag-and-pole pattern on the daily chart. On January 1, 2025, the stock broke out of this pattern with significant trading volumes and is currently holding above the breakout level. According to technical analysis, if the stock sustains this momentum, it may see further upward movement. It's advisable to look for additional confirmations, such as RSI levels and the MACD indicator.

You may add this to your watch list to understand further price action.
Disclaimer: This analysis is purely for educational purpose and does not contain any recommendation. Please consult your financial advisor before taking any financial decision.


