
Stock name: Oberoi Realty Ltd.
Pattern: Resistance breakout
Time frame: Daily
Observation:
The stock experienced steady growth after COVID. From June to October 2024, it consolidated, moving sideways. Recently on 14th October 2024, it broke past the previous all-time high, signalling a decisive breakout. This breakout was supported by a good trading volume. With continuation of the current momentum, technical analysis suggests the stock may see further gains. It's advisable to look for additional confirmations, such as RSI levels and the MACD indicator.
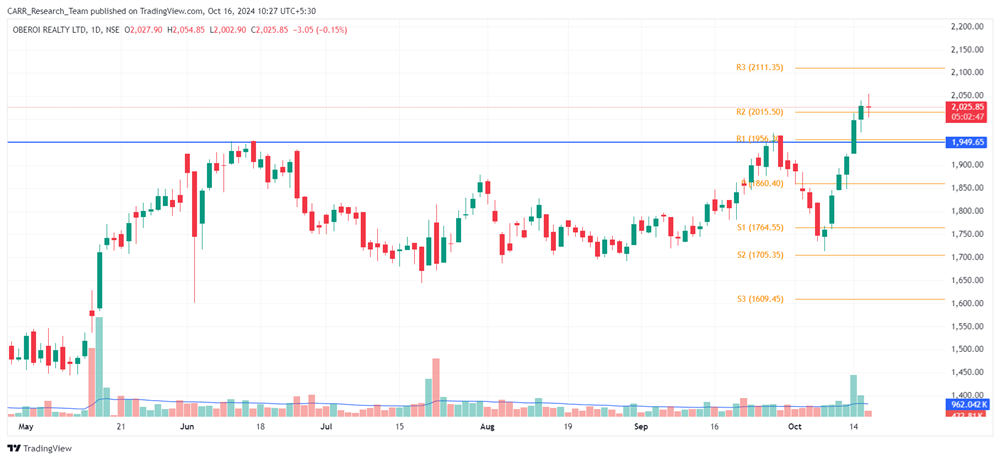
You may add this to your watch list to understand further price action.
Disclaimer: This analysis is purely for educational purpose and does not contain any recommendation. Please consult your financial advisor before taking any financial decision.

Stock name: Hitachi Energy India Ltd.
Pattern: Cup and handle pattern
Time frame: Daily
Observation:
Since October 2023, the stock has been on a strong upward trend. From July to October 2024, it formed a cup and handle pattern on the daily chart. On October 10, 2024, the stock broke out of this pattern with solid trading volume and has remained above the breakout line. According to technical analysis, if it maintains this momentum, the stock may see further gains. It's advisable to look for additional confirmations, such as RSI levels and the MACD indicator.
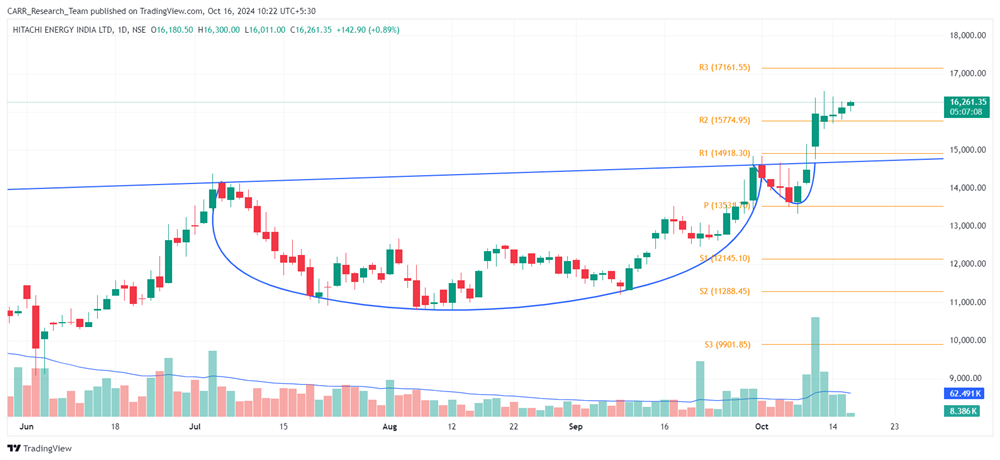
You may add this to your watch list to understand further price action.
Disclaimer: This analysis is purely for educational purpose and does not contain any recommendation. Please consult your financial advisor before taking any financial decision.


