
Stock name: Radico Khaitan Ltd.
Pattern: Cup and handle pattern
Time frame: Daily
Observation:
According to the blog from 4th September 2024 (link for reference), this stock formed a cup and handle pattern on its daily chart from 25th June to 30th August 2024. It broke out from the pattern on 30th August, followed by an upward movement supported by high volume. Since the breakout, the stock has risen by around 20% till 19th September 2024.
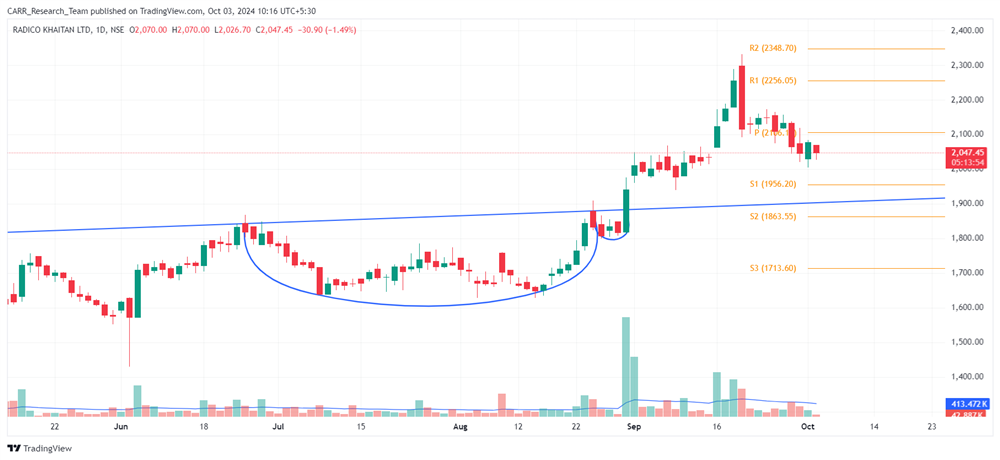
You may add this to your watch list to understand further price action.
Disclaimer: This analysis is purely for educational purpose and does not contain any recommendation. Please consult your financial advisor before taking any financial decision.

Stock name: Amber Enterprises India Ltd.
Pattern: Cup and handle pattern and retest
Time frame: Daily
Observation:
The stock formed a cup and handle pattern on its daily chart from February to September 2024, breaking out on 23rd September 2024. After the breakout, it experienced a sharp retest on the next candle but managed to rebound. However, strong volume support is still lacking to confirm upward momentum. If the stock gains momentum, technical analysis suggests that the stock may see further upward movement. It's advisable to look for additional confirmations, such as RSI levels and the MACD indicator.
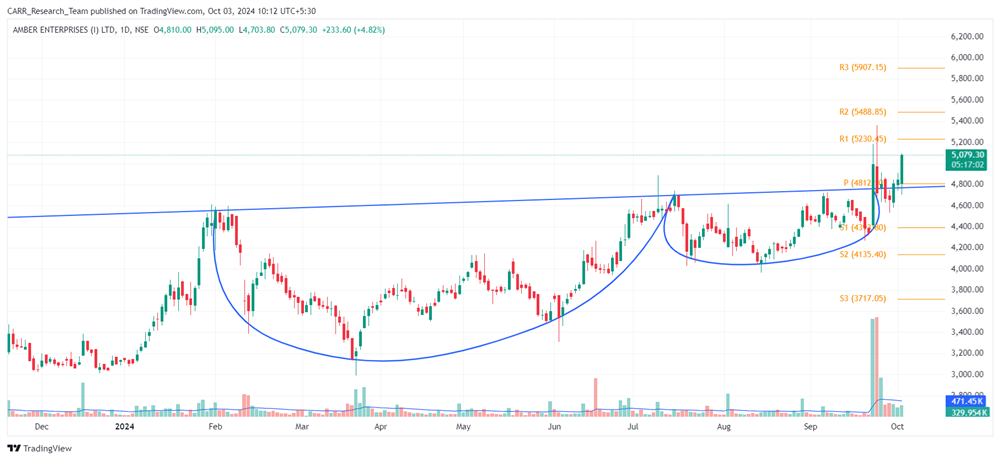
You may add this to your watch list to understand further price action.
Disclaimer: This analysis is purely for educational purpose and does not contain any recommendation. Please consult your financial advisor before taking any financial decision.


