
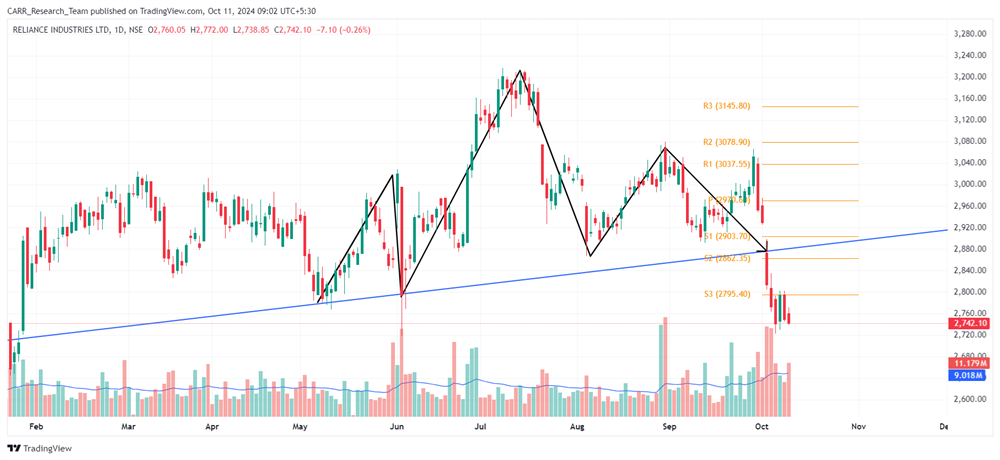
Stock name: Reliance Industries Ltd.
Pattern: Head and shoulders pattern
Time frame: Daily
Observation:
The stock has been in an upward trend since March 2023, but between May and October 2024, it formed a head and shoulders pattern on the daily chart. A breakdown from this pattern occurred on October 3rd, 2024, followed by continued downward movement. Both the breakout and subsequent declines were accompanied by strong trading volume. According to technical analysis, if the stock maintains this momentum, it may decline further. It's advisable to look for additional confirmations, such as RSI levels and the MACD indicator.
You may add this to your watch list to understand further price action.
Disclaimer: This analysis is purely for educational purpose and does not contain any recommendation. Please consult your financial advisor before taking any financial decision.

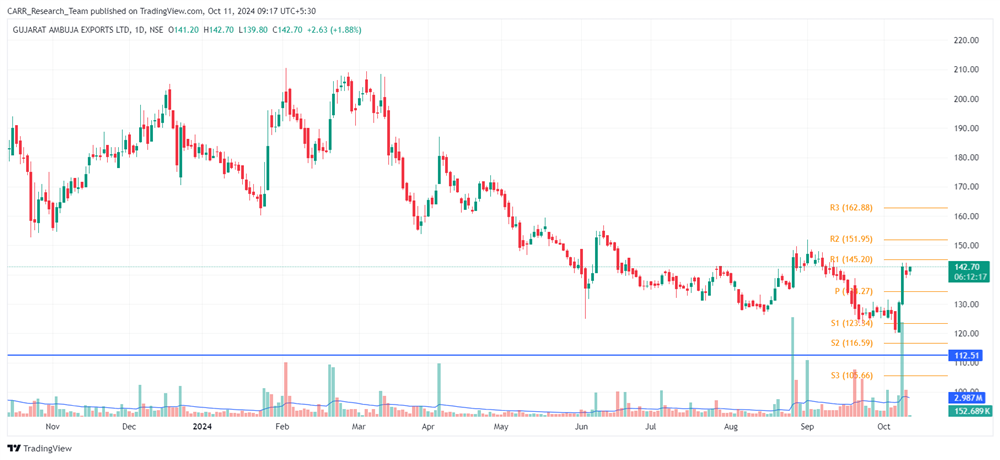
Stock name: Gujarat Ambuja Exports Ltd.
Pattern: Support and reversal (Bullish Engulfing)
Time frame: Daily
Observation:
The stock has been declining since February 2024, nearing a key support level established in 2022. This support has been tested multiple times, making it a strong level. On October 7th and 8th, 2024, the stock formed a bullish engulfing candlestick pattern, followed by a large green candle with significant volume on October 9th. This signals a potential reversal, and if the momentum holds, the stock may move upwards according to technical analysis. It's advisable to look for additional confirmations, such as RSI levels and the MACD indicator.
You may add this to your watch list to understand further price action.
Disclaimer: This analysis is purely for educational purpose and does not contain any recommendation. Please consult your financial advisor before taking any financial decision.


