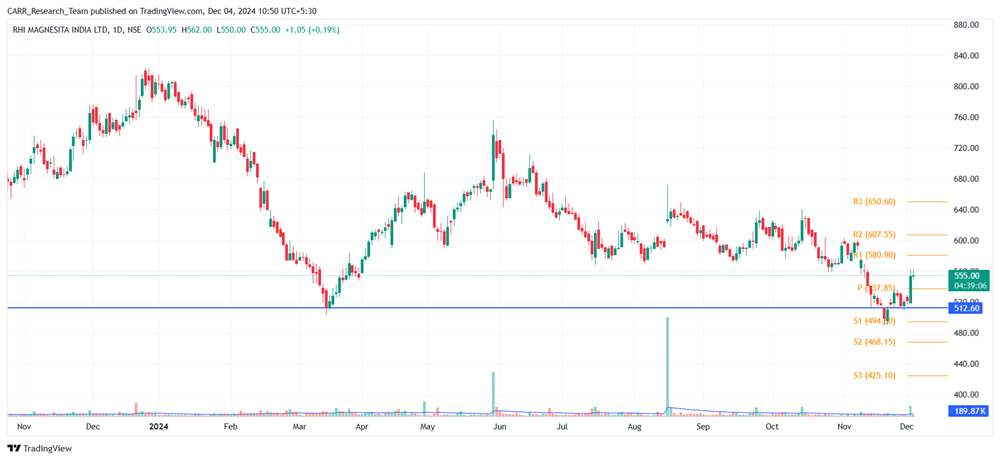
Stock name: RHI MAGNESITA INDIA Ltd.
Pattern: Support and reversal
Time frame: Daily
Observation:
The stock experienced a downward movement from December 2023 to March 2024, forming a support level on the daily chart. After consolidating since July 2024, it briefly dipped below support in November but recovered swiftly. On 03 December 2024, it posted a strong green candle above the support with decent volume. Technical analysis suggests that the stock may rise further if the current momentum sustains. It's advisable to look for additional confirmations, such as RSI levels and the MACD indicator. Top of FormBottom of FormBottom of Form

You may add this to your watch list to understand further price action.
Disclaimer: This analysis is purely for educational purpose and does not contain any recommendation. Please consult your financial advisor before taking any financial decision.

Stock name: Vardhman Textiles Ltd.
Pattern: Double bottom pattern
Time frame: Daily
Observation:
The stock has cooled down from its ATH since July 2024. It has formed a double bottom pattern between October and December 2024. A breakout was registered on 02 December 2024, confirmed by a strong green candle with good volume on 03 December. As per technical analysis if the stock is able to maintain the breakout momentum it may see further upward movement. It's advisable to look for additional confirmations, such as RSI levels and the MACD indicator.

You may add this to your watch list to understand further price action.
Disclaimer: This analysis is purely for educational purpose and does not contain any recommendation. Please consult your financial advisor before taking any financial decision.


