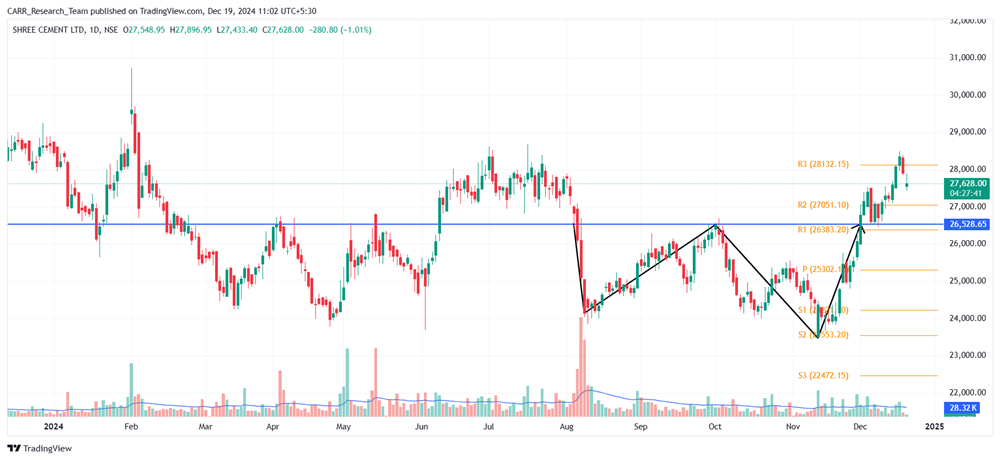
Stock name: Shree Cement Ltd.
Pattern: Double bottom pattern
Time frame: Daily
Observation:
The stock has cooled off from its high on February 1, 2024, and has declined from there onwards. Between August and December 2024, it formed a double bottom pattern on the daily chart. A breakout occurred on December 2, 2024, followed by a successful retest, after which the stock started moving upward. If the current momentum sustains, technical analysis suggests the stock may see further gains. It's advisable to look for additional confirmations, such as RSI levels and the MACD indicator.

You may add this to your watch list to understand further price action.
Disclaimer: This analysis is purely for educational purpose and does not contain any recommendation. Please consult your financial advisor before taking any financial decision.
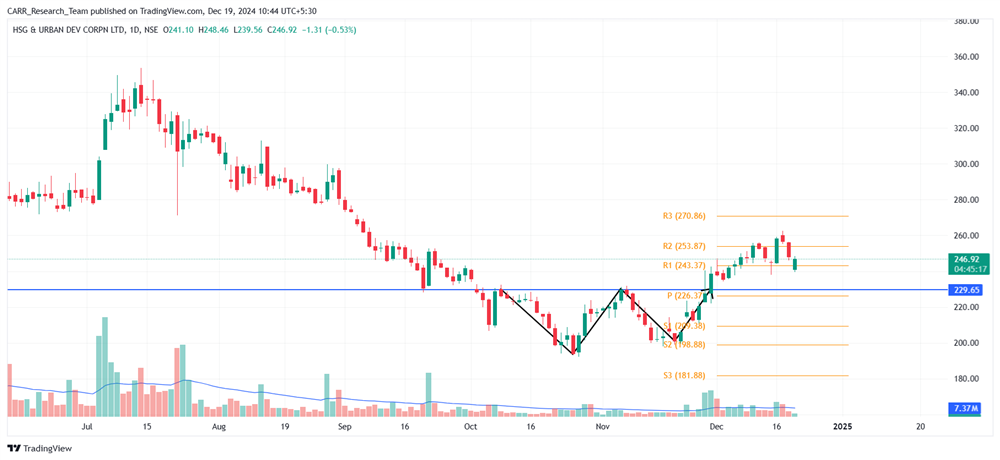
Stock name: Housing & Urban Development Corporation Ltd.
Pattern: Double bottom pattern
Time frame: Daily
Observation:
The stock reached its all-time high (ATH) on July 12, 2024, before cooling off and moved in downward direction. Between October and November 2024, it formed a double bottom pattern on the daily chart, breaking out on November 29, 2024, with significant trading volume. Since the breakout, the stock has moved upward and recently stabilized. According to technical analysis, if it regains momentum, further upside potential may be expected. It's advisable to look for additional confirmations, such as RSI levels and the MACD indicator.

You may add this to your watch list to understand further price action.
Disclaimer: This analysis is purely for educational purpose and does not contain any recommendation. Please consult your financial advisor before taking any financial decision.


