
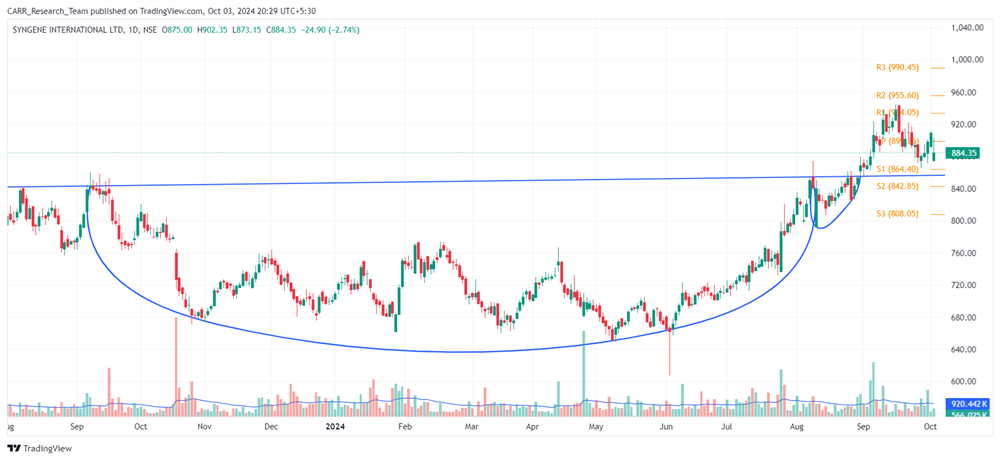
Stock name: Syngene International Ltd.
Pattern: Cup and handle pattern and retest
Time frame: Daily
Observation:
Since the post-Covid period, the stock has experienced significant upward movement. Between September 2023 and August 2024, it formed a cup and handle pattern on its daily chart, with a breakout at the end of August 2024. Following the breakout, the stock saw strong upward movement with solid volume support but later faced a retest. Currently, it appears to have rebounded above the breakout line from the retest and is moving upward again. According to technical analysis, if the stock gains strong momentum from this rebound, the stock may move in further upward direction. It's advisable to look for additional confirmations, such as RSI levels and the MACD indicator.
You may add this to your watch list to understand further price action.
Disclaimer: This analysis is purely for educational purpose and does not contain any recommendation. Please consult your financial advisor before taking any financial decision.

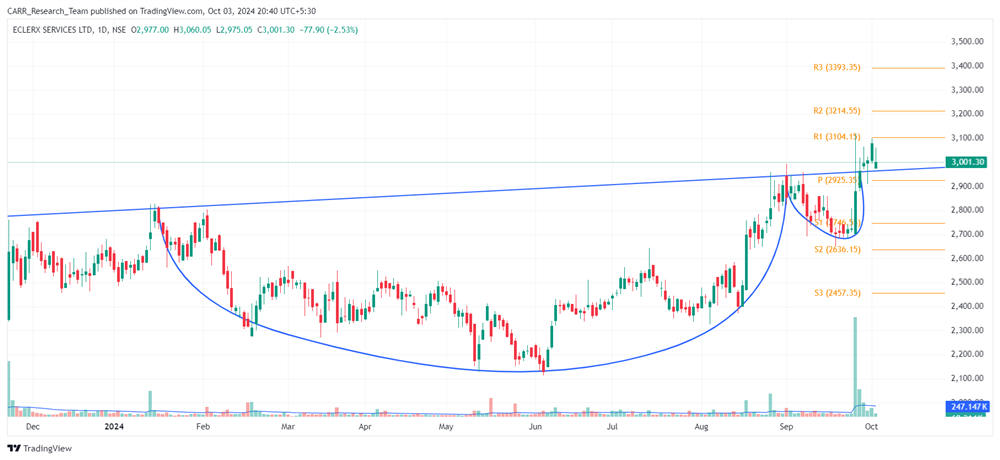
Stock name: eClerx Services Ltd.
Pattern: Cup and handle pattern
Time frame: Daily
Observation:
The stock has followed an upward trend since the post-Covid period. From January to September 2024, it formed a cup and handle pattern on its daily chart. In late September 2024, the stock experienced a strong breakout, supported by substantial volume, and has been moving upward since. According to technical analysis, if the current momentum is maintained, the stock may see further upward movement. It's advisable to look for additional confirmations, such as RSI levels and the MACD indicator.
You may add this to your watch list to understand further price action.
Disclaimer: This analysis is purely for educational purpose and does not contain any recommendation. Please consult your financial advisor before taking any financial decision.


