
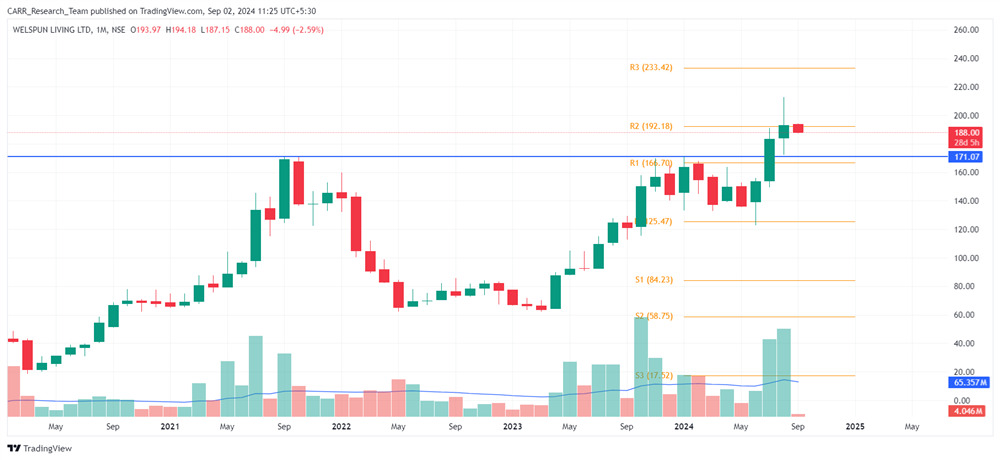
Stock name: Welspun Living Ltd.
Pattern: Resistance breakout pattern
Time frame: Monthly
Observation:
The stock reached its previous high around September-October 2021 before declining. Since November 2023, it attempted to move upward multiple times but faced resistance at the September-October 2021 level. In July 2024, the stock broke through this resistance with strong trading volume, and the upward trend continued with the August 2024 candle. According to technical analysis, if the stock maintains its current momentum, it may see further upward movement. It's advisable to look for additional confirmations, such as RSI levels and the MACD indicator.
You may add this to your watch list to understand further price action.
Disclaimer: This analysis is purely for educational purpose and does not contain any recommendation. Please consult your financial advisor before taking any financial decision.

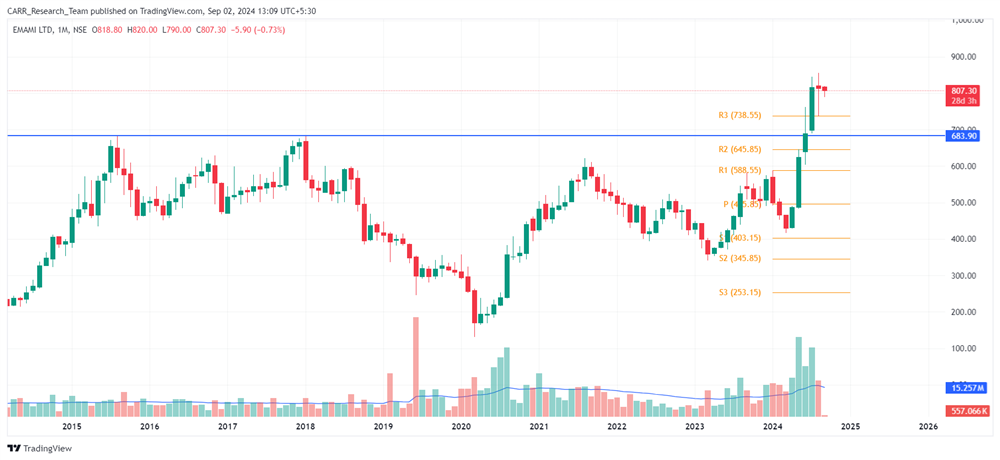
Stock name: Emami Ltd.
Pattern: Resistance breakout pattern
Time frame: Monthly
Observation:
The stock reached its previous high in 2015, forming resistance around the 680 level. In June 2024, it broke through this resistance with strong trading volume, and the upward trend continued in July 2024. The stock was able to sustain the level in August 2024. According to technical analysis, if the stock maintains its momentum, it may move further upward. It's advisable to look for additional confirmations, such as RSI levels and the MACD indicator.
You may add this to your watch list to understand further price action.
Disclaimer: This analysis is purely for educational purpose and does not contain any recommendation. Please consult your financial advisor before taking any financial decision.

