
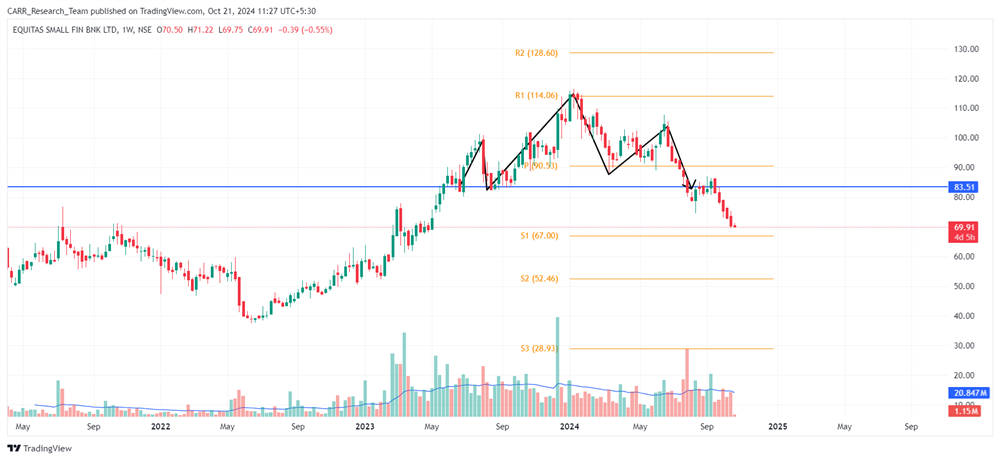
Stock name: Equitas Small Finance Bank Ltd.
Pattern: Head and shoulders pattern and retest
Time frame: Weekly
Observation:
The stock has been in an uptrend since June 2022. From June 2023 to July 2024, it consolidated and formed a head and shoulders pattern on the weekly chart, breaking down in the last candle of July with strong volume. After retesting the breakdown level, it resumed its downward move. According to technical analysis, if the current momentum persists, further declines may occur. It's advisable to look for additional confirmations, such as RSI levels and the MACD indicator.
You may add this to your watch list to understand further price action.
Disclaimer: This analysis is purely for educational purpose and does not contain any recommendation. Please consult your financial advisor before taking any financial decision.

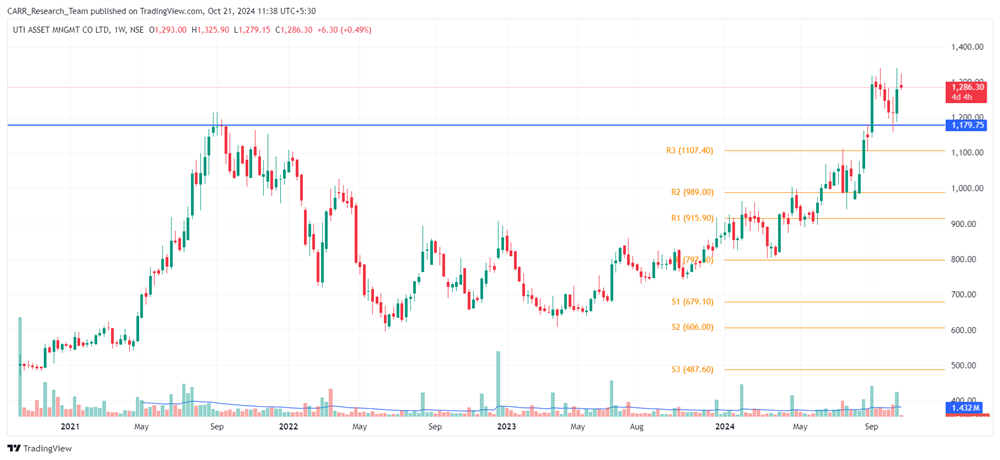
Stock name: UTI Asset Management Company Ltd.
Pattern: Resistance breakout
Time frame: Weekly
Observation:
The stock experienced a strong upward movement since its listing, reaching its previous all-time high (ATH) in September 2021. After a downward phase until May 2023, it began to recover and broke through its previous ATH in September 2024, supported by strong volume. The stock has since retested the breakout level and, in the latest weekly candle, rebounded from the retest with good volume. According to technical analysis, if the stock can maintain this rebound momentum, further upward movement may follow. It's advisable to look for additional confirmations, such as RSI levels and the MACD indicator.
You may add this to your watch list to understand further price action.
Disclaimer: This analysis is purely for educational purpose and does not contain any recommendation. Please consult your financial advisor before taking any financial decision.


