In the world of technical analysis, breakouts/breakdowns are powerful signals that can help traders anticipate major market moves. One of the most significant patterns for identifying potential short-selling or downside opportunities is the Horizontal Support Breakdown.
A horizontal support breakdown occurs when the price of a stock breaks below a well-defined support level that has repeatedly prevented the price from falling further.
Support Level: A support level is where buying pressure historically halts price declines. When price repeatedly fails to break below a flat level, it forms horizontal support, seen as a straight line on the chart.
Breakdown: A breakdown happens when the price convincingly closes below this support level, signalling a potential shift in market sentiment from bullish or neutral to bearish.
How to Trade a Horizontal Support Breakdown
Entry Point
- Enter the trade once the price closes below the horizontal support on strong volume.
- A confirmed breakdown typically includes above-average volume and a decisive candle body (not just a wick below support).
- A better approach can be to enter 50% of your quantity at breakdown and 50% after a confirmation candle.
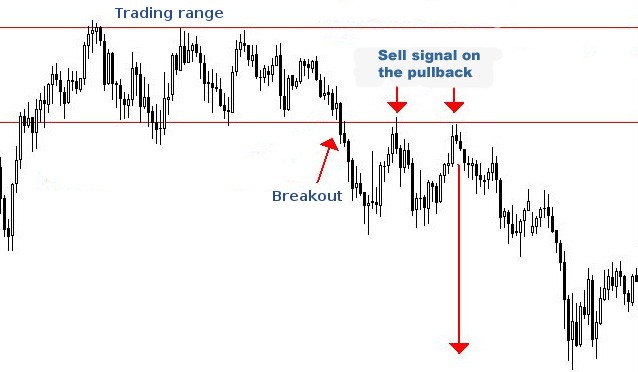
A retest happens when the price, after breaking below support, pulls back to test that former support level—now acting as resistance.
This is a healthy market behaviour and adds credibility to the breakdown.

How to use the retest in your strategy:
- Wait for the price to pull back to the breakdown level.
- Look for bearish reversal patterns (e.g., shooting star, bearish engulfing) or resistance-holding price action near the breakdown zone.
- Enter the trade if the level holds and price resumes downward movement.
- This provides a better risk-reward entry and helps filter out false breakdowns.
- Using chart:
- Measure the height of the prior range (from support to resistance).
- Subtract this height to the breakdown point. Target = Support Level - (Resistance - Support)
- Fibonacci Extension or Pivot Points: These tools can also be used to estimate logical support levels or profit-taking zones above the breakout.
- Place a stop-loss just above the breakdown level or above the most recent swing high.
- A tighter stop-loss can be placed at the high point of the breakdown candle.
- Combine support breakdown patterns with momentum indicators like RSI or MACD to confirm bearish strength.
- Look for breakdowns occurring in weak market trends or sectors showing relative underperformance.
- Always use a risk-reward ratio of at least 1:2 to make your trades worthwhile.
Homework: Check the following two stocks and select the one that fits the horizontal resistance breakout pattern.
1. Five-Star Business Finance Ltd. (FIVESTAR)
2. ITC Ltd. (ITC)
You may also add the stock to your watch list to understand further price action.
Disclaimer: This analysis is purely for educational purpose and does not contain any recommendation. Please consult your financial advisor before taking any financial decision.