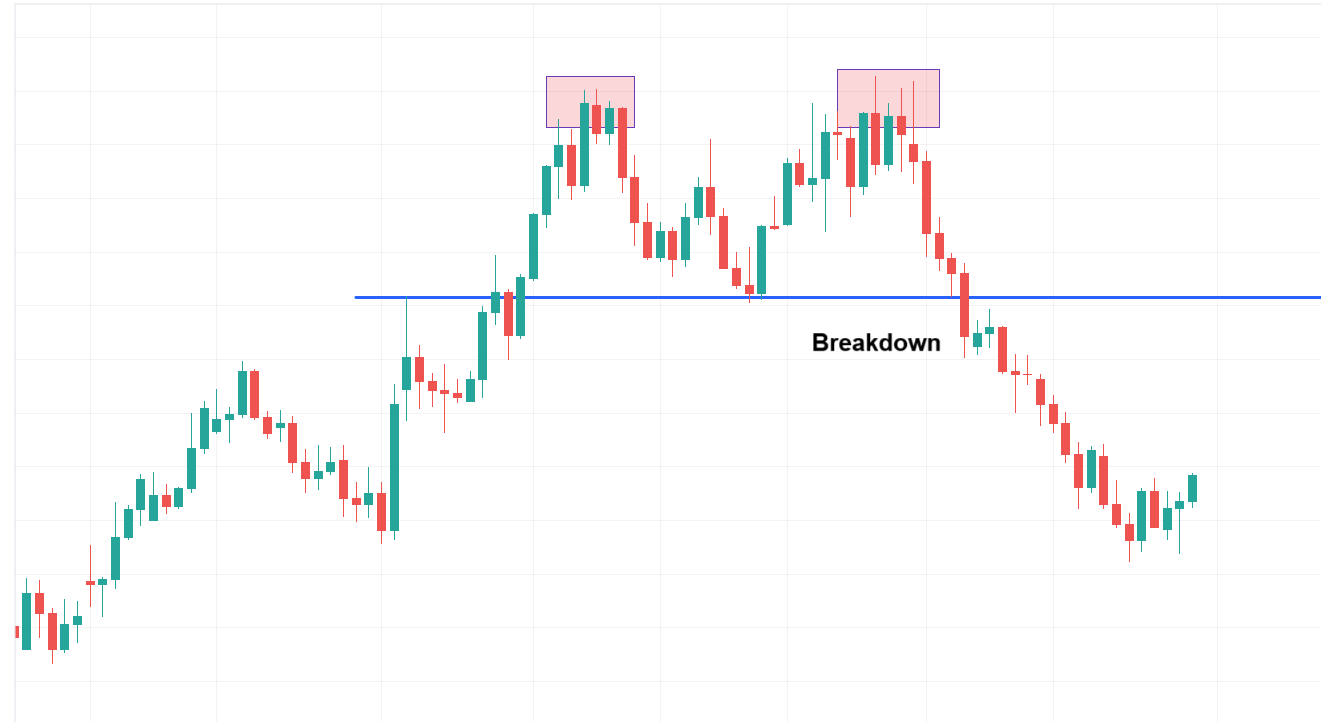
In the world of technical analysis, breakouts/breakdowns are powerful signals that can help traders anticipate major market moves. One of the most significant patterns for identifying potential short-selling or downside opportunities is the Horizontal Support Breakdown.
A horizontal support breakdown occurs when the price of a stock breaks below a well-defined support level that has repeatedly prevented the price from falling further.
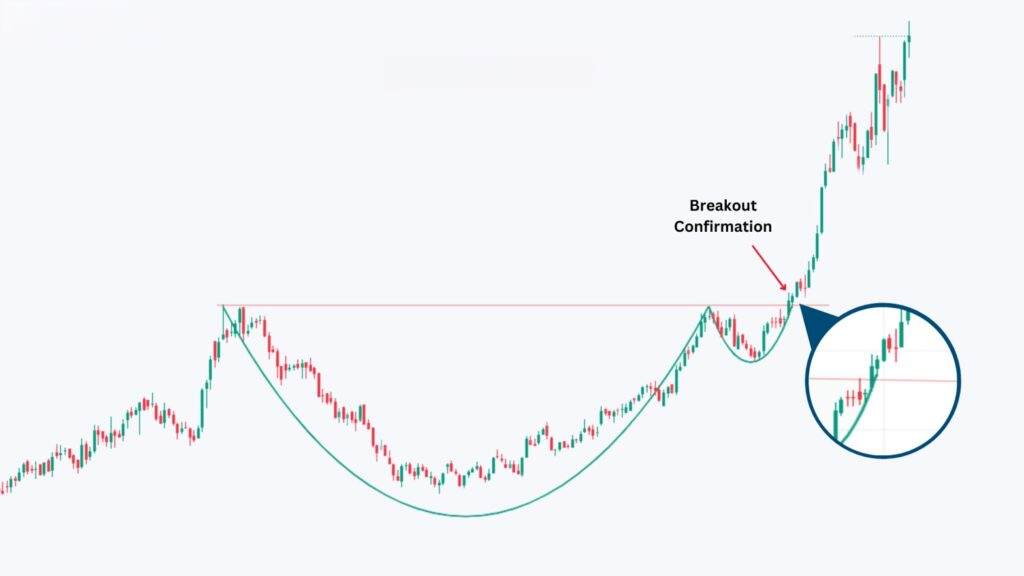
Support Level: A support level is where buying pressure historically halts price declines. When price repeatedly fails to break below a flat level, it forms horizontal support, seen as a straight line on the chart.
Breakdown: A breakdown happens when the price convincingly closes below this support level, signalling a potential shift in market sentiment from bullish or neutral to bearish.
How to Trade a Horizontal Support Breakdown
Entry Point
- Enter the trade once the price closes below the horizontal support on strong volume.
- A confirmed breakdown typically includes above-average volume and a decisive candle body (not just a wick below support).
- A better approach can be to enter 50% of your quantity at breakdown and 50% after a confirmation candle.
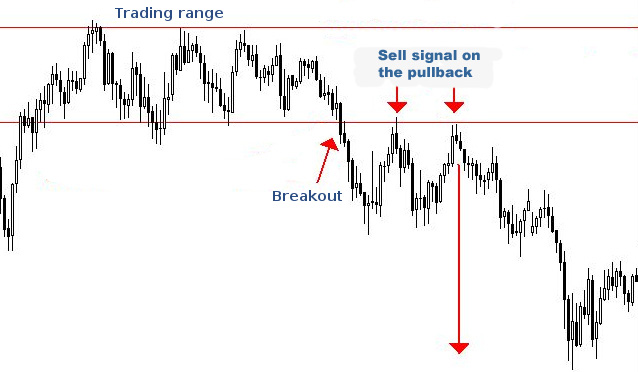
Understanding the Retest of a Breakdown
A retest happens when the price, after breaking below support, pulls back to test that former support level—now acting as resistance.
This is a healthy market behaviour and adds credibility to the breakdown.
How to use the retest in your strategy:
- Wait for the price to pull back to the breakdown level.
- Look for bearish reversal patterns (e.g., shooting star, bearish engulfing) or resistance-holding price action near the breakdown zone.
- Enter the trade if the level holds and price resumes downward movement.
- This provides a better risk-reward entry and helps filter out false breakdowns.
Target Price: There are a few ways to estimate the target price:

- Using chart:
- Measure the height of the prior range (from support to resistance).
- Subtract this height to the breakdown point. Target = Support Level - (Resistance - Support)
- Fibonacci Extension or Pivot Points: These tools can also be used to estimate logical support levels or profit-taking zones above the breakout.
Stop-Loss Placement
- Place a stop-loss just above the breakdown level or above the most recent swing high.
- A tighter stop-loss can be placed at the high point of the breakdown candle.
Additional Tips
- Combine support breakdown patterns with momentum indicators like RSI or MACD to confirm bearish strength.
- Look for breakdowns occurring in weak market trends or sectors showing relative underperformance.
- Always use a risk-reward ratio of at least 1:2 to make your trades worthwhile.
Charting Exercise: Open a daily chart and do your own technical analysis. Identify a stock showing a clear horizontal support level and then breakdown from the same. Mark these levels along with price target and stop-loss.
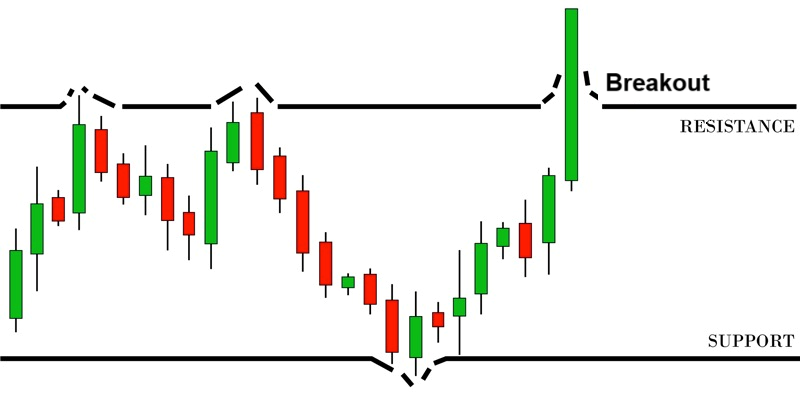
Homework: Check the following two stocks and select the one that fits the horizontal resistance breakout pattern.
1. Whirlpool of India Ltd. (WHIRLPOOL)
2. Shriram Finance Ltd. (SHRIRAMFIN)
You may also add the stock to your watch list to understand further price action.
Disclaimer: This analysis is purely for educational purpose and does not contain any recommendation. Please consult your financial advisor before taking any financial decision.