In technical analysis, certain chart patterns stand out for their reliability in predicting trend reversals. One such powerful bullish reversal pattern is the Inverse Head and Shoulders. Let’s understanding this pattern as it may provide a significant edge, especially when spotting a potential shift from a downtrend to an uptrend.
The Inverse Head and Shoulders pattern typically forms after a prolonged downtrend, signalling that the selling pressure is waning and a bullish reversal may be on the horizon.
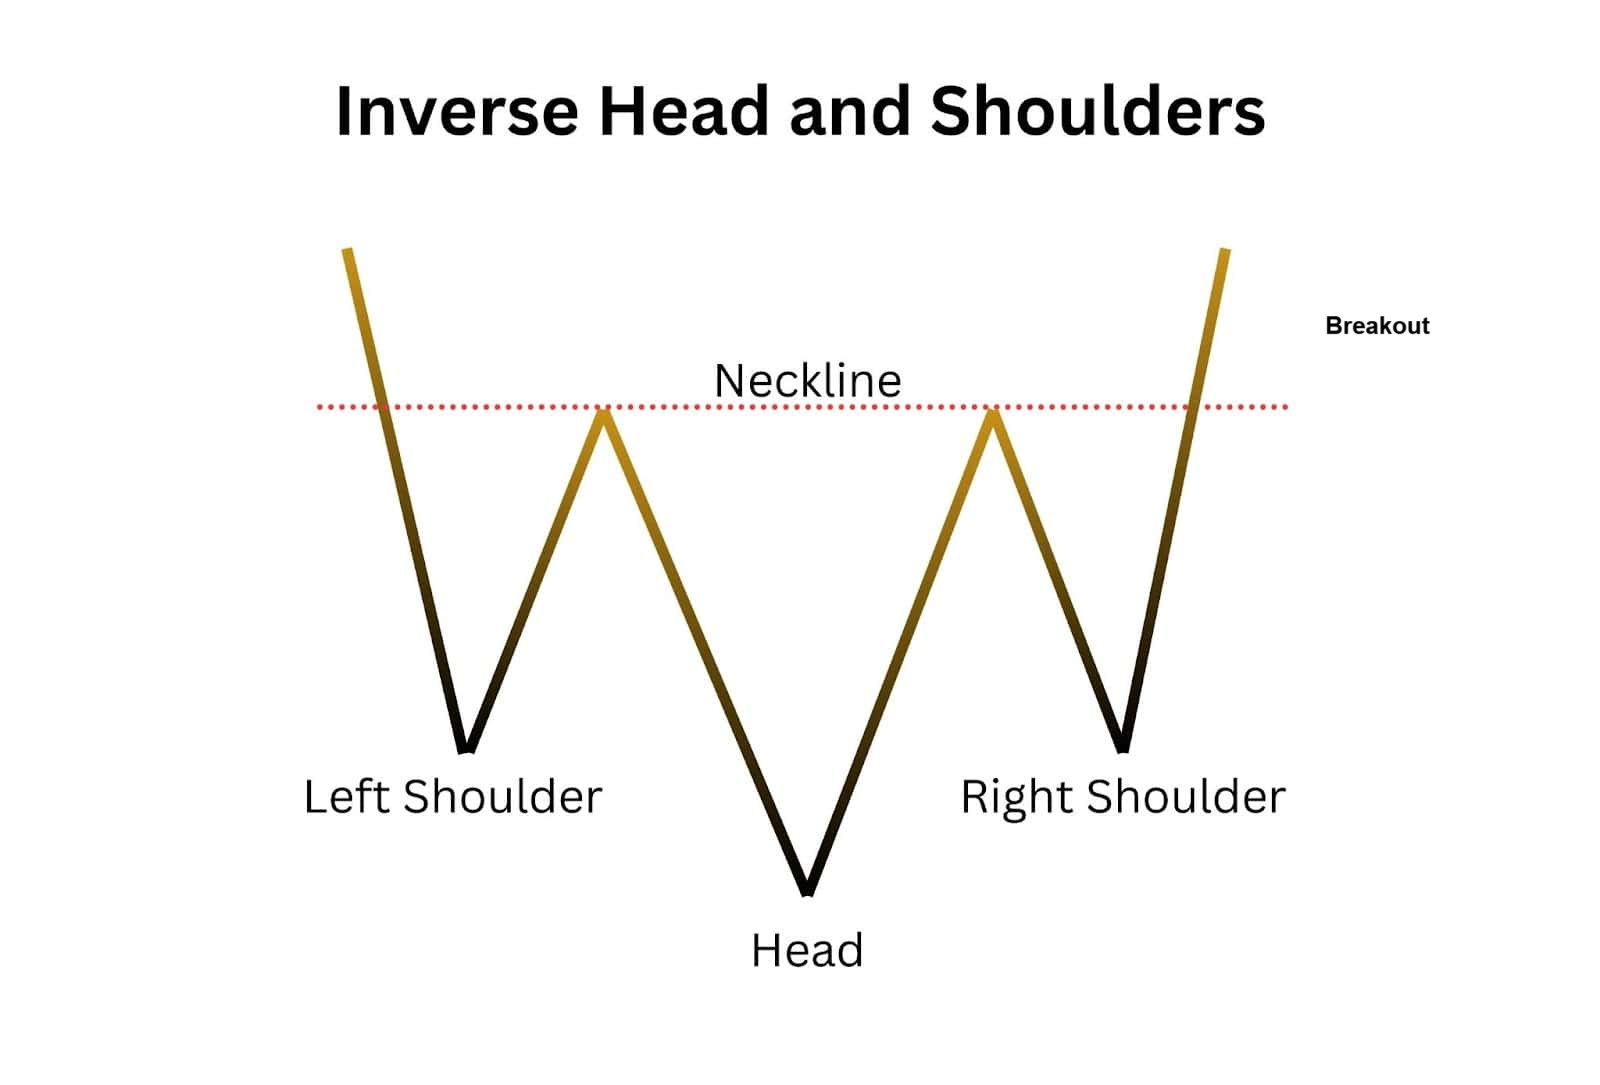
Pattern Anatomy
1. Left Shoulder: Formed when the price drops to a trough and then rallies.
2. Head: A deeper decline follows, creating a lower low, then another rally.
3. Right Shoulder: Price declines again but forms a higher low, followed by another upward move.
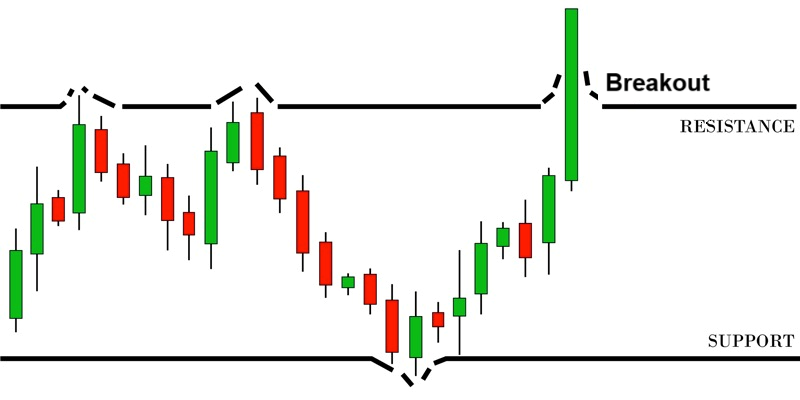
4. Neckline (Resistance): The highs of the rallies after the left shoulder and head create a horizontal or slightly sloped resistance line. A breakout above this neckline confirms the pattern.
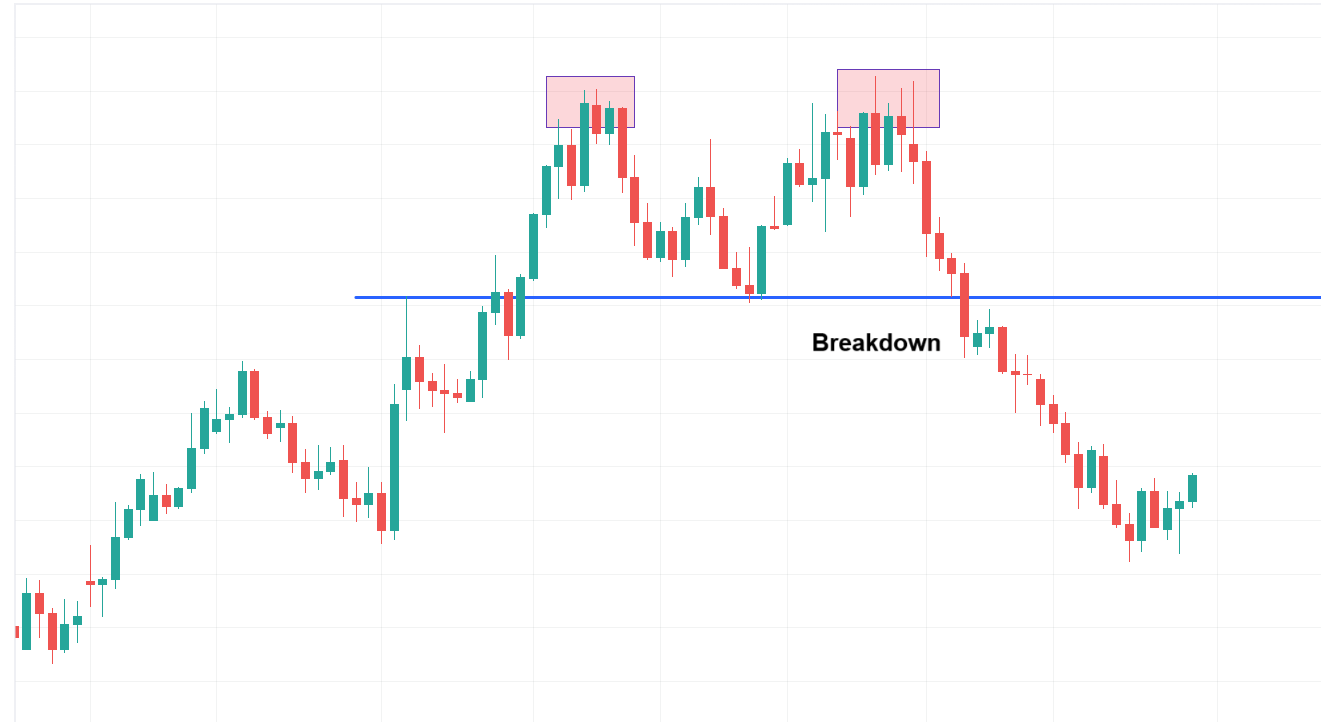
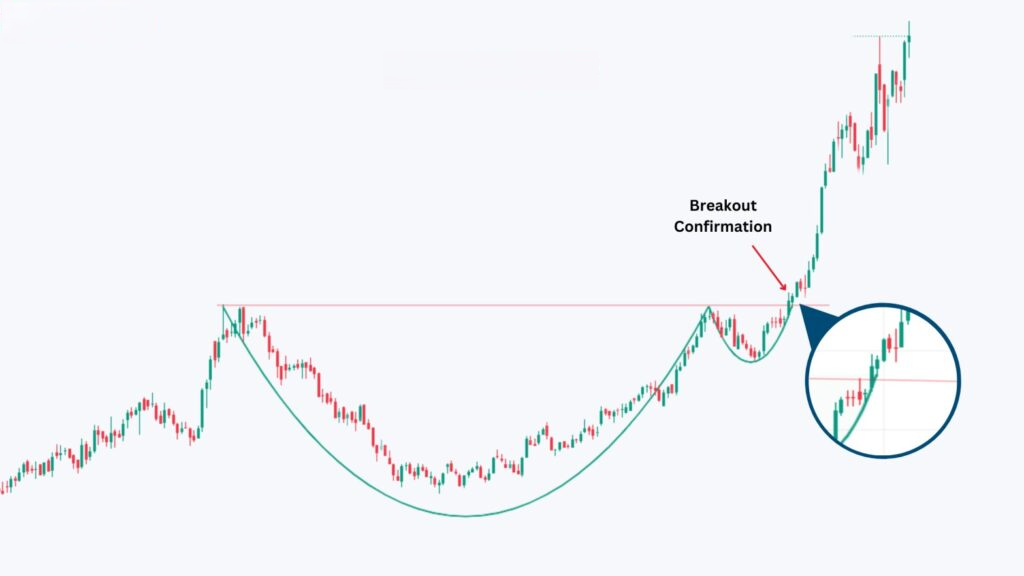
Breakout and Retest: Key Confirmation
The pattern completes when price breaks above the neckline — ideally on increased volume, signalling a shift in market sentiment from bearish to bullish.
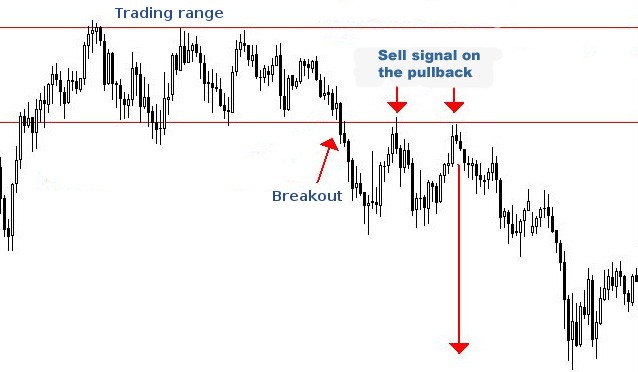
Retest: A Second Chance Entry
After the breakout, prices often retrace back to the neckline, testing it as a new support level. This retest offers a lower-risk entry opportunity:
- A successful retest (where the neckline holds and price bounces) adds confidence to the reversal.
- Traders can enter on a bullish candlestick confirmation after the retest.
- This is especially helpful in filtering out false breakouts or low-volume moves.
Entry Point
- Enter the trade when the price closes above the neckline with solid volume.
- Look for a bullish breakout candle that holds above the neckline, avoiding false breakouts with only wicks or intraday spikes.
- A balanced approach: enter 50% at breakout, and the remaining 50% after a confirmation candle to reduce risk.
- There is another chance to enter the trade if there is a successful retest of the breakout.
Target Price: Use these methods to project the expected price move:
- Chart-Based Target:
- Measure the vertical distance from the head (lowest point) to the neckline.
- Add that distance to the breakout point.
- Target = Neckline + (Neckline - Head)
- Alternative Methods:
- Apply Fibonacci Extensions to project targets.
- Use Pivot Points to identify likely resistance levels post-breakout.
- A stop-loss can be placed just below the right shoulder or even below the head, depending on risk tolerance.
- A tighter stop-loss may be the low of the breakout candle or last swing low before breakout.

- Preceding Trend: This pattern must be preceded by a visible downtrend — it's a reversal, not a continuation pattern.
- Volume Confirmation: A breakout with rising volume confirms stronger buying interest.
- Indicators: Use RSI or MACD to support the bullish reversal — look for bullish divergence or positive crossovers.
- Patience Pays: Let the full pattern form. Enter only after the neckline is breached with conviction.
- Macro View: Align your trades with the broader market trend for increased reliability.
- Left Shoulder, Head, Right Shoulder
- Neckline
- Potential Breakout, Entry, Stop-loss, and Target zones.