Filter
RSS

Blog

Technical Analysis of RATNAMANI & IRCON

Stock name: Ratnamani Metals & Tubes Ltd.

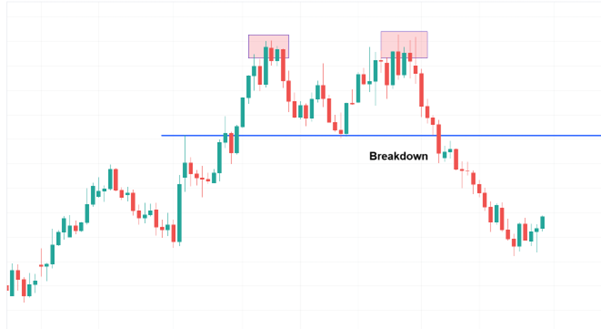
Pattern: Head and shoulders pattern

Time frame: Daily

Observation:

The stock experienced a strong upward movement starting in March 2024. However, between June and November 2024, it formed a head and shoulders pattern on the daily chart, followed by a significant breakdown in late November 2024. This was further confirmed by continued red candles with high volumes on December 4 and December 12, 2024. According to technical analysis, if the stock sustains the breakdown momentum, it may see further downside. It's advisable to look for additional confirmations, such as RSI levels and the MACD indicator.

You may add this to your watch list to understand further price action.

Disclaimer: This analysis is purely for educational purpose and does not contain any recommendation. Please consult your financial advisor before taking any financial decision.

Stock name: IRCON International Ltd.

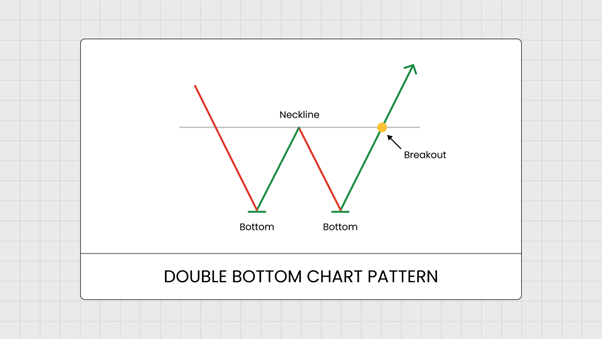
Pattern: Double bottom pattern

Time frame: Daily

Observation:

The stock reached its all-time high (ATH) on July 15, 2024, before cooling off. From October 2024 to December 2024, it formed a double bottom pattern on the daily chart, breaking out of the pattern on December 6, 2024. This breakout was confirmed by a significant green candle with strong volumes on December 11, 2024. Currently the stock is holding the breakout level. According to technical analysis, the stock may rise further if it sustains its momentum. It's advisable to look for additional confirmations, such as RSI levels and the MACD indicator.

You may add this to your watch list to understand further price action.

Disclaimer: This analysis is purely for educational purpose and does not contain any recommendation. Please consult your financial advisor before taking any financial decision.

Technical Analysis of RATNAMANI & IRCON
Read More
Technical Analysis of GRINDWELL & HDFCBANK

Stock name: Grindwell Norton Ltd.

Pattern: Support and reversal

Time frame: Weekly

Observation:

The stock has maintained an overall uptrend, forming an inclined support line on the weekly chart from August 2021 to December 2024. It has repeatedly rebounded from this support, most recently in late November 2024, after cooling off from its ATH since July 2024. This rebound, supported by strong trading volume, has led to an upward movement. According to technical analysis, if the current momentum sustains, the stock may witness further upward progress. It's advisable to look for additional confirmations, such as RSI levels and the MACD indicator.

You may add this to your watch list to understand further price action.

Disclaimer: This analysis is purely for educational purpose and does not contain any recommendation. Please consult your financial advisor before taking any financial decision

Stock name: HDFC Bank Ltd.

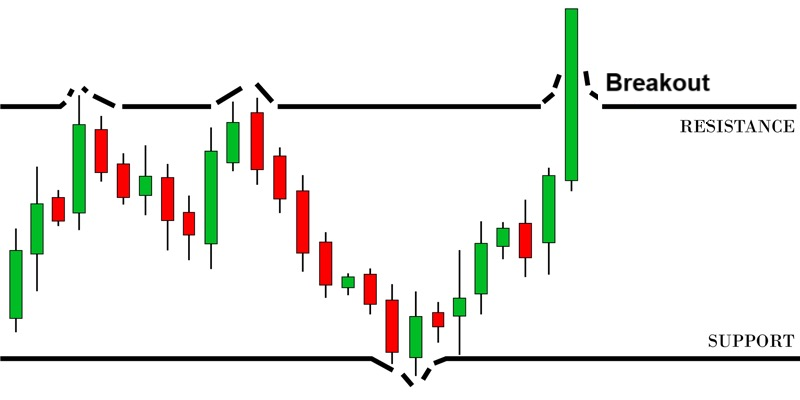
Pattern: Resistance breakout

Time frame: Weekly

Observation:

Post-COVID, the stock saw a swift recovery, reaching its peak by October 2021. Since then, it has traded sideways, forming a resistance near its ATH, with multiple unsuccessful breakout attempts. Even though the stock has breached the highs of October 2021 there was no significant upward movement. However, in late November 2024, the stock finally broke out of this pattern with strong volumes, marking a decisive upward move. Currently at its highest price, technical analysis suggests that sustained momentum could lead to further gains. It's advisable to look for additional confirmations, such as RSI levels and the MACD indicator.

You may add this to your watch list to understand further price action.

Disclaimer: This analysis is purely for educational purpose and does not contain any recommendation. Please consult your financial advisor before taking any financial decision.

Technical Analysis of GRINDWELL & HDFCBANK
Read More
Switzerland’s MFN Withdrawal: Implications for Indian Firms and Global Taxation Policies

Switzerland’s withdrawal of the Most Favoured Nation (MFN) clause from its Double Taxation Avoidance Agreement (DTAA) with India will increase costs for Indian firms operating in Switzerland, particularly in financial services, pharmaceuticals, and IT. Effective January 1, 2025, these firms will face a 10% tax on dividends and other incomes, up from the previous 5% rate. According to the Global Trade Research Initiative (GTRI), this higher tax liability will reduce the competitiveness of Indian businesses compared to firms from countries still enjoying MFN benefits.

Switzerland’s decision stems from a recent Indian Supreme Court ruling in the Nestlé case (October 2023), which clarified India’s stance on the MFN clause. The court ruled that MFN benefits cannot be automatically applied to the India-Switzerland treaty unless explicitly notified under Section 90 of the Indian Income Tax Act. The judgment also limited the MFN clause to OECD member countries as of 1994, when the treaty was signed, excluding nations like Colombia and Lithuania, which joined the OECD later.

Switzerland disagreed with India’s interpretation for two key reasons. First, Switzerland believed the MFN clause should automatically apply, allowing India to benefit from reduced tax rates extended to newer OECD members like Colombia, which joined in 2020. Based on this understanding, Switzerland had unilaterally reduced the residual tax rate on dividends to 5%. Second, Switzerland argued that subsequent OECD members should qualify for MFN benefits, contrary to India’s position. These differences led Switzerland to suspend the MFN clause and revert to the higher 10% tax rate.

GTRI noted that Switzerland’s decision could have broader implications for India’s approach to MFN clauses in bilateral treaties. The Supreme Court’s ruling sets a precedent that may influence similar agreements with other trading partners. If such disputes persist, Indian businesses could face higher tax burdens and compliance challenges in other jurisdictions, potentially discouraging outbound investments.

India has previously faced issues with its DTAAs, particularly with Australia. Indian software firms have long disputed Australia’s classification of payments for software licenses and services as royalties, which are subject to source taxation. Indian firms argue these payments should be treated as business income, taxable only in India unless they have a permanent establishment in Australia. This mismatch in interpretations leads to double taxation risks and compliance challenges, compounded by Australia’s reliance on domestic laws that may override treaty provisions.

The GTRI emphasizes the need for India to adopt a consistent and strategic approach to international taxation treaties. The suspension of the MFN clause by Switzerland and the ongoing issues with Australia highlight gaps in India’s DTAA frameworks. GTRI recommends that India modernize its treaty provisions to reflect contemporary business realities, particularly in the digital and service sectors. A more proactive and cohesive approach is essential to reduce tax uncertainties, enhance global competitiveness, and safeguard outbound investments by Indian businesses.


Switzerland’s MFN Withdrawal: Implications for Indian Firms and Global Taxation Policies
Read More
Technical Analysis of 360ONE & TITAGARH

Stock name: 360 ONE WAM Ltd.

Pattern: Resistance breakout

Time frame: Daily

Observation:

The stock has been on an upward trajectory since its listing, reaching its all-time high on August 1, 2024. Since then, it has consolidated, forming a resistance line near the body of the ATH candle. Between August and December 2024, the stock repeatedly attempted to break this resistance but closed below it each time. After a failed breakout on December 2, the stock achieved a decisive breakout on December 9, followed by a continuation candle on December 10 with strong trading volume. Currently, the stock is holding above the breakout level, and technical analysis suggests it may rise further if the momentum sustains. It's advisable to look for additional confirmations, such as RSI levels and the MACD indicator.

You may add this to your watch list to understand further price action.

Disclaimer: This analysis is purely for educational purpose and does not contain any recommendation. Please consult your financial advisor before taking any financial decision.
Stock name: Titagarh Rail Systems Ltd.

Pattern: Double bottom pattern

Time frame: Daily

Observation:

The stock reached its all-time high in June 2024, followed by a cooling-off period and a downward movement. Between September and December 2024, it formed a double bottom pattern on the daily chart, breaking out on December 11 with significant trading volume. The stock sustained the breakout level in the following session. According to technical analysis, maintaining this momentum may lead to rapid upward movement. It's advisable to look for additional confirmations, such as RSI levels and the MACD indicator.


You may add this to your watch list to understand further price action.

Disclaimer: This analysis is purely for educational purpose and does not contain any recommendation. Please consult your financial advisor before taking any financial decision.

Technical Analysis of 360ONE & TITAGARH
Read More
Technical Analysis of MINDACORP & MINDACORP

Stock name: Minda Corporation Ltd.

Pattern: Double bottom pattern

Time frame: Daily

Observation:

After reaching its ATH in August 2024, the stock experienced a cooling-off period. Between October and December 2024, it formed a double bottom pattern on the daily chart and registered a breakout on December 10, 2024, supported by strong trading volume. The breakout was sustained in the following candle. According to technical analysis, if the stock maintains this momentum, the stock may see further price appreciation. It's advisable to look for additional confirmations, such as RSI levels and the MACD indicator.

You may add this to your watch list to understand further price action.

Disclaimer: This analysis is purely for educational purpose and does not contain any recommendation. Please consult your financial advisor before taking any financial decision.

Stock name: Chalet Hotels Ltd.

Pattern: Ascending triangle pattern

Time frame: Daily

Observation:

The stock reached its previous all-time high (ATH) on March 28, 2024, and formed a resistance line around that level. Despite an overall upward trend, it struggled to break through this resistance. Between December 2023 and December 2024, the stock formed an ascending triangle pattern on the daily chart and achieved a decisive breakout on December 9, 2024, supported by high volume. As per technical analysis, if the stock sustains this momentum it may rise further. It's advisable to look for additional confirmations, such as RSI levels and the MACD indicator.

You may add this to your watch list to understand further price action.

Disclaimer: This analysis is purely for educational purpose and does not contain any recommendation. Please consult your financial advisor before taking any financial decision.

Technical Analysis of MINDACORP & MINDACORP
Read More
Technical Analysis of JSL & TRIVENI

Stock name: Jindal Stainless Ltd.

Pattern: Double bottom pattern

Time frame: Daily

Observation:

The stock reached its all-time high in July 2024 before entering a cooling-off phase with a downward movement. Between October and December 2024, it formed a double bottom pattern on the daily chart, breaking out of the pattern on December 4. Since then, the stock has been moving upward, though trading volume remains low. According to technical analysis, if the stock gains momentum and increases in volume, it may experience a rapid upward movement. It's advisable to look for additional confirmations, such as RSI levels and the MACD indicator.

You may add this to your watch list to understand further price action.

Disclaimer: This analysis is purely for educational purpose and does not contain any recommendation. Please consult your financial advisor before taking any financial decision.
Stock name: Triveni Engineering & Industries Ltd.

Pattern: Resistance breakout

Time frame: Daily

Observation:

The stock hit its all-time high in mid-September 2024 before cooling off and forming a head and shoulders pattern on its daily chart. It broke out downward from the pattern, with the breakout level acting as resistance. Later on, the stock has rebounded on November 22 breaking the downward momentum. The stock broke above this resistance on December 5 with strong momentum and high volume, maintaining the level since. On December 10, it saw further upward movement with significant volume, suggesting that continued momentum may lead to more gains according to technical analysis. It's advisable to look for additional confirmations, such as RSI levels and the MACD indicator.

You may add this to your watch list to understand further price action.

Disclaimer: This analysis is purely for educational purpose and does not contain any recommendation. Please consult your financial advisor before taking any financial decision.

Technical Analysis of JSL & TRIVENI
Read More
Technical Analysis of NHPC & LEMONTREE

Stock name: NHPC Ltd.

Pattern: Support and reversal

Time frame: Daily

Observation:

Post the COVID period, the stock has been on an upward trajectory. By late January 2024, a surge in trading volume established a strong support line, which the stock has repeatedly held since February 2024. Following a market-wide decline, the stock reached this support line towards the end of October 2024 and consolidated above it. The stock has rebounded on 19 November 2024. This was further supported by green candles on 25 November and 06 December with good trading volumes. As per technical analysis, it may move further upward if momentum continues. It's advisable to look for additional confirmations, such as RSI levels and the MACD indicator.

You may add this to your watch list to understand further price action.

Disclaimer: This analysis is purely for educational purpose and does not contain any recommendation. Please consult your financial advisor before taking any financial decision.

Stock name: Lemon Tree Hotels Ltd.

Pattern: Double bottom pattern

Time frame: Daily

Observation:

The stock reached its all-time high (ATH) on May 6, 2024, before cooling off and moving in the downward direction. Between August and December 2024, it formed a double bottom pattern on the daily chart. A breakout from the pattern occurred on December 6, 2024, followed by a significant green candle with high trading volume on December 9, 2024. According to technical analysis, sustained momentum may lead to further upside movement. It's advisable to look for additional confirmations, such as RSI levels and the MACD indicator.

You may add this to your watch list to understand further price action.

Disclaimer: This analysis is purely for educational purpose and does not contain any recommendation. Please consult your financial advisor before taking any financial decision.

Technical Analysis of NHPC & LEMONTREE
Read More
Technical Analysis ASIANPAINT & KIMS

Stock name: Asian Paints Ltd.

Pattern: Support breakdown

Time frame: Weekly

Observation:

The stock has been trading within a parallel channel since May 2021. It has seen a sharp downward movement in September 2024. In November 2024, it experienced a significant gap-down breakdown below the channel's support level. Following this, the stock continued its decline with successive bearish candles. Technical analysis suggests that if the current momentum persists, the stock may see further downward movement. It's advisable to look for additional confirmations, such as RSI levels and the MACD indicator. 

You may add this to your watch list to understand further price action.

Disclaimer: This analysis is purely for educational purpose and does not contain any recommendation. Please consult your financial advisor before taking any financial decision.

Stock name: Krishna Institute of Medical Sciences Ltd.

Pattern: Flag and pole pattern

Time frame: Weekly

Observation:

Listed on the NSE in June 2021, the stock has been in an upward trend from the get go. It saw a rapid surge in August and early September 2024 before entering a consolidation phase from September 9, forming a flag and pole pattern on the weekly chart. A breakout from this pattern occurred in November 2024, after which the stock resumed its upward trajectory. Technical analysis indicates that if the current momentum sustains, the stock may rise further. It's advisable to look for additional confirmations, such as RSI levels and the MACD indicator.

You may add this to your watch list to understand further price action.

Disclaimer: This analysis is purely for educational purpose and does not contain any recommendation. Please consult your financial advisor before taking any financial decision.

Technical Analysis ASIANPAINT & KIMS
Read More
Technical Analysis of CDSL & DATAPATTNS

Stock name: Central Depository Services (India) Ltd.

Pattern: Resistance breakout

Time frame: Daily

Observation:

The stock reached its previous high on August 23, 2024, and has since been consolidating, forming a resistance level on its daily chart. Despite multiple attempts, the stock struggled to break past this level. However, on December 4, 2024, it experienced a significant breakout, confirmed by a massive green candle and high trading volume in the next session. With this momentum, the stock is currently moving in the all-time high levels, and technical analysis indicates that it may rise further if the trend continues. It's advisable to look for additional confirmations, such as RSI levels and the MACD indicator. Top of FormBottom of FormBottom of Form

You may add this to your watch list to understand further price action.

Disclaimer: This analysis is purely for educational purpose and does not contain any recommendation. Please consult your financial advisor before taking any financial decision.

Stock name: Data Patterns (India) Ltd.

Pattern: Triple bottom pattern

Time frame: Daily

Observation:

The stock hit its all-time high in July 2024 but has since trended downward. Between September and December 2024, it formed a triple-bottom pattern on the daily chart. On December 4, 2024, the stock broke out with high volumes and sustained this level in the following session. If the breakout momentum continues, technical analysis suggests that the stock may see further upward movement. It's advisable to look for additional confirmations, such as RSI levels and the MACD indicator.

You may add this to your watch list to understand further price action.

Disclaimer: This analysis is purely for educational purpose and does not contain any recommendation. Please consult your financial advisor before taking any financial decision.

Technical Analysis of CDSL & DATAPATTNS
Read More