Stock name: Amber Enterprises India Ltd.
Pattern: Cup and handle
Time frame: Daily
Observation:
Referring to the previous blog on October 3, 2024 (link for reference), the stock had formed a cup and handle pattern on its daily chart, with a breakout confirmed on September 23, 2024. After a brief retest, the stock rebounded on October 3, moving upward strongly to achieve the target set by this technical pattern. Top of FormBottom of FormBottom of Form
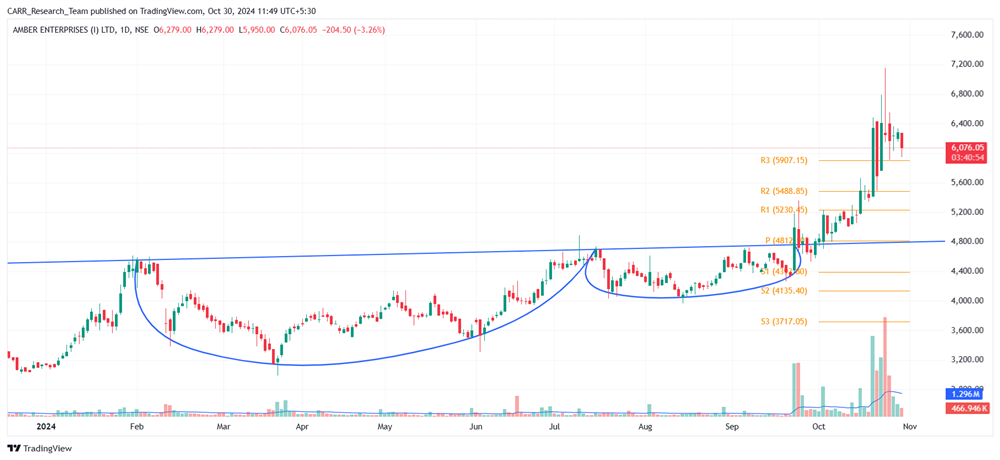
You may add this to your watch list to understand further price action.
Disclaimer: This analysis is purely for educational purpose and does not contain any recommendation. Please consult your financial advisor before taking any financial decision.

Stock name: City Union Bank Ltd.
Pattern: Resistance breakout
Time frame: Daily
Observation:
Since July 2024, the stock has encountered strong resistance, keeping its movement range-bound. The stock has seen multiple touch points at the resistance level but was unable to register a clear breakout. On October 22nd, however, a significant upward move accompanied by high trading volumes began, leading to a decisive breakout on October 29th. Technical analysis suggests that if the stock maintains this momentum, further upward movement may follow. It's advisable to look for additional confirmations, such as RSI levels and the MACD indicator.
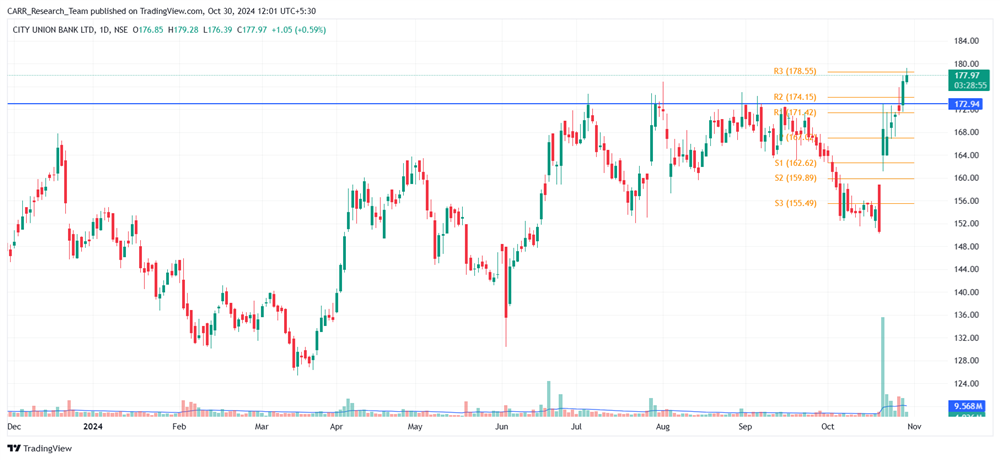
You may add this to your watch list to understand further price action.
Disclaimer: This analysis is purely for educational purpose and does not contain any recommendation. Please consult your financial advisor before taking any financial decision.