Filter
RSS

Blog posts of '2024' 'November'

Technical Analysis of QUESS & SWANENERGY

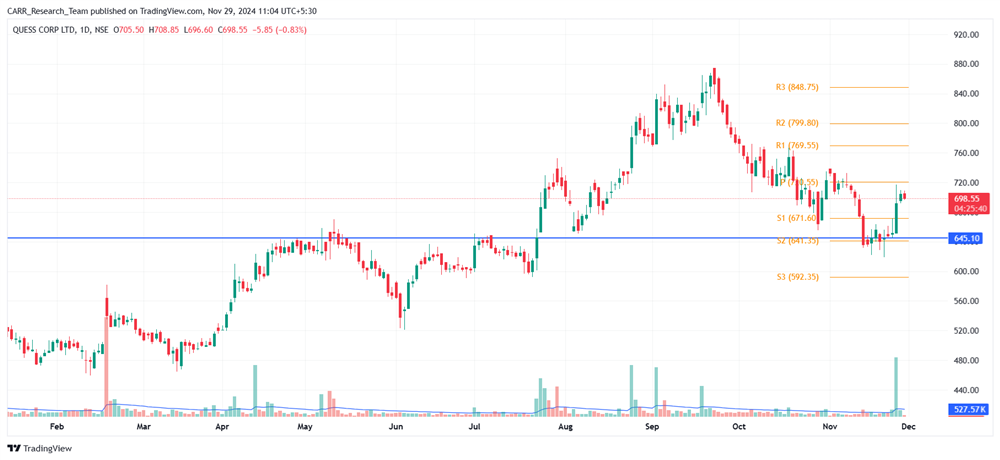
Stock name: Quess Corp Ltd.

Pattern: Support and reversal

Time frame: Daily

Observation:

The stock formed an inverted head and shoulders pattern and registered a breakout in July 2024, followed by an upward move. However, influenced by overall market sentiment, the stock retraced and, by November 2024, reached its previous breakout level, which is now acting as a support. On November 27, 2024, the stock witnessed a strong rebound with significantly high trading volumes. If it can sustain this rebound level, technical analysis suggests that the stock may move further upward. It's advisable to look for additional confirmations, such as RSI levels and the MACD indicator. 

You may add this to your watch list to understand further price action.

Disclaimer: This analysis is purely for educational purpose and does not contain any recommendation. Please consult your financial advisor before taking any financial decision.

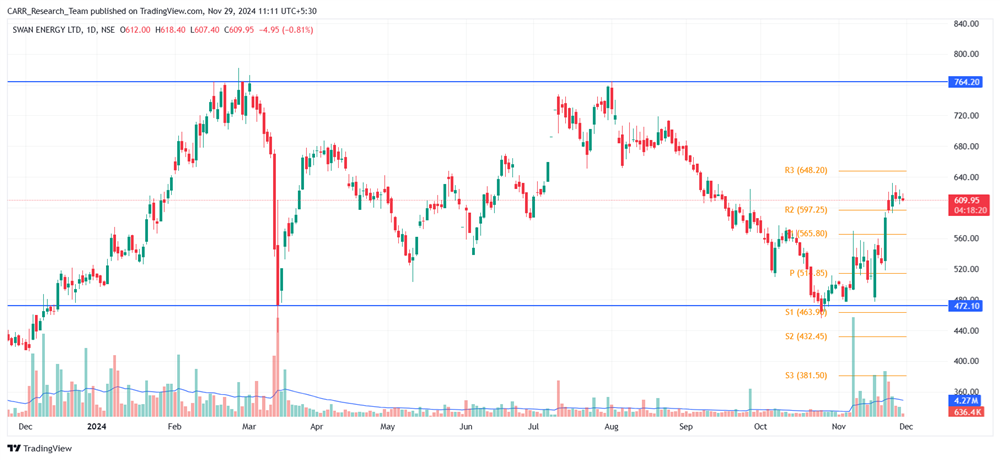
Stock name: Swan Energy Ltd.

Pattern: Support and reversal

Time frame: Daily

Observation:

The stock has been in an overall uptrend but recently entered a phase of consolidation, moving sideways since December 2023 within a parallel channel on the daily chart. On October 25, 2024, it touched the channel's support level and rebounded strongly. This rebound was followed by multiple green candles accompanied by high trading volumes, signalling strong buying interest. If the stock sustains its current momentum, technical analysis suggests that it may see further upward movement. It's advisable to look for additional confirmations, such as RSI levels and the MACD indicator.

You may add this to your watch list to understand further price action.

Disclaimer: This analysis is purely for educational purpose and does not contain any recommendation. Please consult your financial advisor before taking any financial decision.

Technical Analysis of QUESS & SWANENERGY
Read More
Technical Analysis of PIIND & GICRE

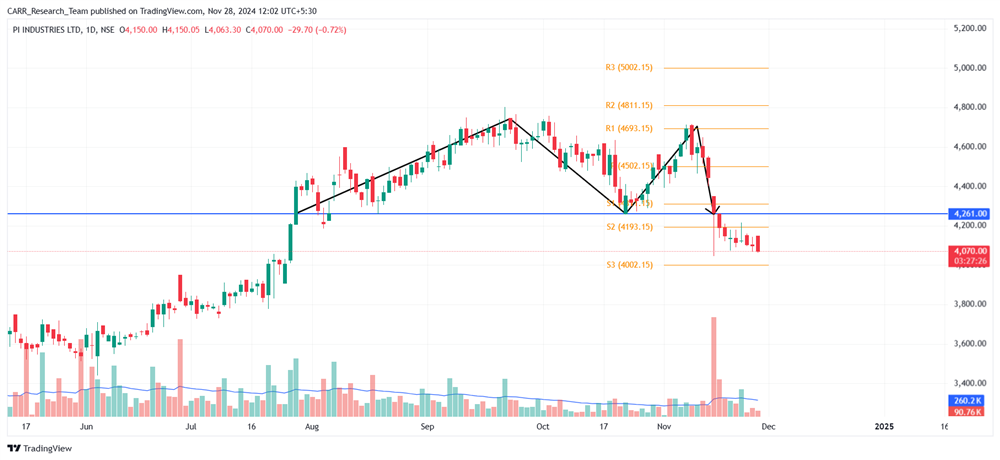
Stock name: PI Industries Ltd.

Pattern: Double top pattern

Time frame: Daily

Observation:

The stock has shown an overall upward trend but formed a double top pattern between July and November 2024 on its daily chart. A breakdown occurred between November 14-18, supported by significant trading volumes. Following the breakout, the stock has moved downward. If this momentum sustains, technical analysis suggests that the stock may further decline. It's advisable to look for additional confirmations, such as RSI levels and the MACD indicator. Top of FormBottom of FormBottom of Form

You may add this to your watch list to understand further price action.

Disclaimer: This analysis is purely for educational purpose and does not contain any recommendation. Please consult your financial advisor before taking any financial decision.

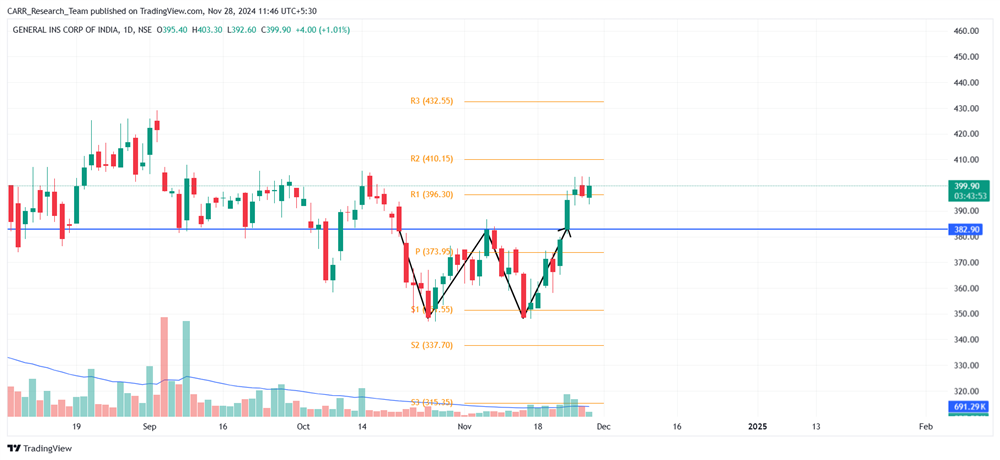
Stock name: General Insurance Corporation of India

Pattern: Double bottom pattern

Time frame: Daily

Observation:

The stock has cooled down and experienced a downward movement since August 2024. It has formed a double bottom pattern on its daily chart between October and November 2024. A breakout occurred on November 25, 2024, and the stock has since sustained the level, moving slightly upward. Technical analysis suggests that if the stock maintains its upward momentum, it may see further gains. It's advisable to look for additional confirmations, such as RSI levels and the MACD indicator.


You may add this to your watch list to understand further price action.

Disclaimer: This analysis is purely for educational purpose and does not contain any recommendation. Please consult your financial advisor before taking any financial decision.

Technical Analysis of PIIND & GICRE
Read More
Technical Analysis ADANIGREEN & APOLLOTYRE

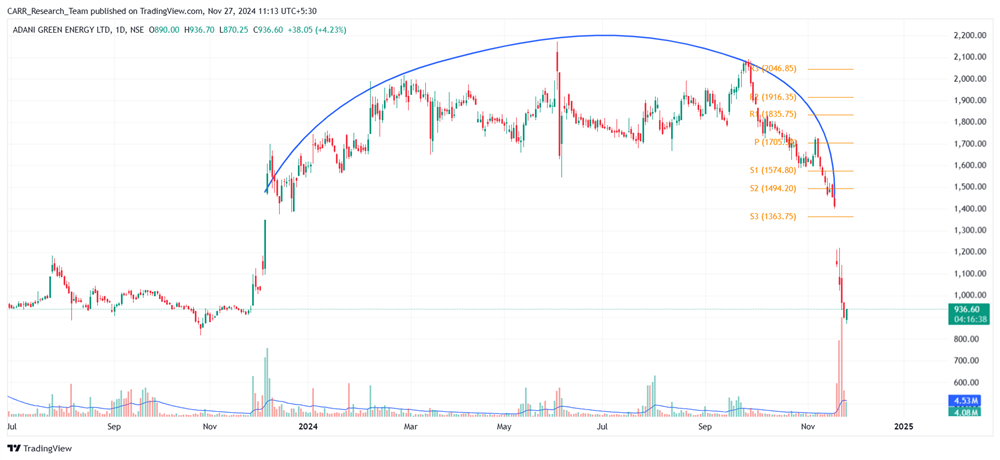
Stock name: Adani Green Energy Ltd.

Pattern: Island reversal

Time frame: Daily

Observation:

The stock formed a gap-up in December 2023, followed by an upward movement before reversing its trend. On November 21, 2024, it registered a gap-down, creating a bearish island pattern on the daily chart. This breakdown triggered a sharp downward movement with significant momentum. Currently, the stock is at a key support level, and if the downward momentum persists, it may see further declines. It's advisable to look for additional confirmations, such as RSI levels and the MACD indicator. Top of FormBottom of FormBottom of Form

You may add this to your watch list to understand further price action.

Disclaimer: This analysis is purely for educational purpose and does not contain any recommendation. Please consult your financial advisor before taking any financial decision.

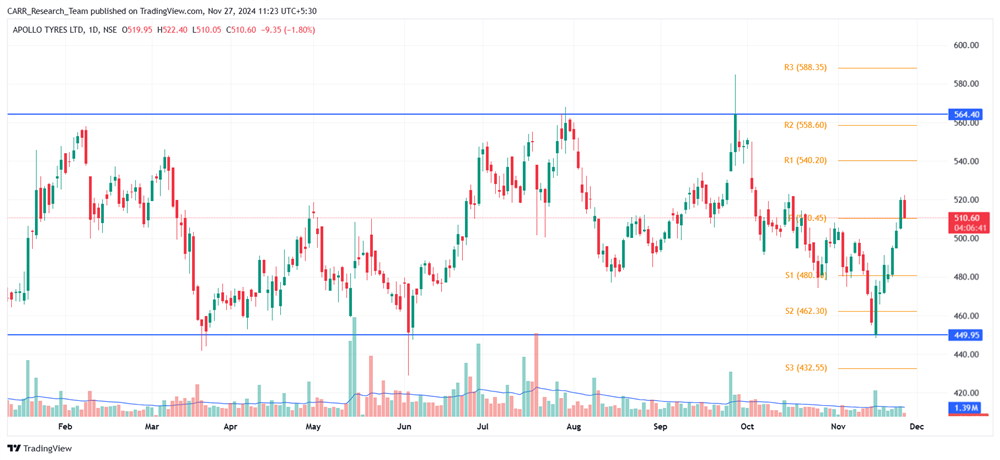
Stock name: Apollo Tyres Ltd.

Pattern: Support and reversal

Time frame: Daily

Observation:

Since December 2023, the stock has been trading within a parallel channel, rebounding multiple times from its support level. Following a downward movement since September 2024, it again touched the support on November 14, 2024, and rebounded with strong volume support. Post-rebound, the stock has shown consistent green candles, indicating positive momentum. If this momentum continues, technical analysis suggests that the stock may see further upward movement within the channel. It's advisable to look for additional confirmations, such as RSI levels and the MACD indicator.

You may add this to your watch list to understand further price action.

Disclaimer: This analysis is purely for educational purpose and does not contain any recommendation. Please consult your financial advisor before taking any financial decision.

Technical Analysis ADANIGREEN & APOLLOTYRE
Read More
Technical Analysis of PGHH & GODREJIND

Stock name: Procter & Gamble Hygiene & Health Care Ltd.

Pattern: Support and reversal

Time frame: Daily

Observation:

The stock experienced strong upward movement from August to November 2023, followed by a cooling phase until March 2024. Since then, it has traded sideways, establishing a support level at around March 2024 low. On November 12, 2024, the stock rebounded from this support, showing high volumes and forming multiple green candles as it moved upward. If the momentum continues, technical analysis indicates that the stock may see further gains. It's advisable to look for additional confirmations, such as RSI levels and the MACD indicator. Top of FormBottom of FormBottom of Form

You may add this to your watch list to understand further price action.

Disclaimer: This analysis is purely for educational purpose and does not contain any recommendation. Please consult your financial advisor before taking any financial decision.

Stock name: Godrej Industries Ltd.

Pattern: Support and reversal

Time frame: Daily

Observation:

The stock has been trending upward since April 2023 and formed a cup and handle pattern between May and August 2024, followed by a breakout. The breakout level now acts as support. The stock has seen a good upward movement after the breakout before declining in line with the broader market. On November 18, 2024, it rebounded strongly with high volumes around the support level. If the stock sustains its momentum, technical analysis suggests that it may see further gains. It's advisable to look for additional confirmations, such as RSI levels and the MACD indicator.

You may add this to your watch list to understand further price action.

Disclaimer: This analysis is purely for educational purpose and does not contain any recommendation. Please consult your financial advisor before taking any financial decision.

Technical Analysis of PGHH & GODREJIND
Read More
Technical Analysis of UTIAMC & ABSLAMC

Stock name: UTI Asset Management Company Ltd.

Pattern: Resistance breakout and retest

Time frame: Weekly

Observation:

The stock, listed in October 2020, saw a steady rise until September 2021 before reversing into a downward trend. It began improving only after June 2023, eventually surpassing its previous high in September 2024. Following the breakout, the stock retested the breakout level and rebounded strongly with good volume by late October 2024. According to technical analysis, sustaining the rebound momentum may lead to further upward movement. It's advisable to look for additional confirmations, such as RSI levels and the MACD indicator. Top of FormBottom of FormBottom of Form

You may add this to your watch list to understand further price action.

Disclaimer: This analysis is purely for educational purpose and does not contain any recommendation. Please consult your financial advisor before taking any financial decision.

Stock name: Aditya Birla Sun Life AMC Ltd.

Pattern: Resistance breakout and retest

Time frame: Weekly

Observation:

The stock debuted on the NSE in 2021 and experienced a downward trend until March 2023. It then recovered to its listing levels by July 2024, forming a resistance line where it lingered before breaking out in August. Despite the breakout, the stock showed low upward momentum and underwent a retest. By mid-October 2024, it rebounded strongly with significant trading volume, boosting its upward momentum. If the current momentum holds, technical analysis suggests the stock may continue to rise further. It's advisable to look for additional confirmations, such as RSI levels and the MACD indicator.

You may add this to your watch list to understand further price action.

Disclaimer: This analysis is purely for educational purpose and does not contain any recommendation. Please consult your financial advisor before taking any financial decision.

Technical Analysis of UTIAMC & ABSLAMC
Read More

India’s hotel industry is witnessing remarkable growth, marked by a surge in branded hotel signups and a rapidly expanding inventory. As per hospitality consultancy Hotelivate, the country is set to add approximately 94,000 branded hotel rooms by 2028-29, complementing the existing inventory of 192,000 rooms. This expansion reflects a robust domestic market and increased penetration of hospitality brands in Tier 2 and Tier 3 cities, shifting the sector’s reliance away from foreign tourist business.

Growth Momentum in Branded Inventory

Between March and August 2024, India’s branded hotel inventory witnessed a net addition of 12,000 rooms, while a further 5,500 rooms were added to the supply pipeline. Manav Thadani, founder chairman of Hotelivate, emphasized this positive trend, underscoring the buoyant demand driving growth.

Among Indian hotel chains, Tata Group-backed Indian Hotels Company Limited (IHCL) is leading the charge with plans to open 17,354 rooms over the next three to four years. Under its ACCELERATE 2030 strategy, IHCL aims to expand its current portfolio from 350 to over 700 hotels by 2030. This aggressive growth strategy is expected to boost its enterprise revenue from ₹13,000 crore to over ₹30,000 crore.

International Players Expand Footprint

Global hotel chains are also scaling up their operations in India. Marriott International, with 153 hotels and 29,000 rooms in its existing inventory, plans to open more than 40 hotels, adding over 6,500 rooms in the next five years. Similarly, Radisson Hotel Group, currently managing 125 hotels with 13,948 rooms, has a pipeline of 81 hotels comprising 7,985 keys.

Radisson has prioritized expanding into Tier 2 and Tier 3 cities, where it is often the sole international brand present. Marriott and Radisson’s strategic focus on smaller cities highlights their commitment to tapping into underserved markets.

ITC Hotels, another significant player, is also pursuing an ambitious growth agenda. Its current portfolio of 140 hotels with 13,000 rooms is set to expand to 200 hotels with approximately 18,000 keys by 2030. The brand's spokesperson highlighted the company’s focus on quality-driven offerings across luxury, boutique, and experiential segments.

Midscale and Budget Brands Drive Growth

The growth is not limited to luxury and premium segments. Budget and midscale brands such as Lemon Tree Hotels are capitalizing on demand from business and leisure travellers. Lemon Tree is poised to add 4,700 rooms across 70 hotels over the next four to five years.

Hilton and Accor are also rapidly expanding their presence in India. Hilton’s strategic partnership with Olive by Embassy will introduce 150 Spark by Hilton hotels across the country, strengthening its pipeline. This initiative aligns with Hilton’s broader plan to grow its portfolio to 200 hotels, surpassing its earlier goal of tripling its Indian footprint to 75 properties.

Accor, known for its diverse range of brands, has signed deals for hotels in key cultural and religious destinations such as Jaipur, Varanasi, Amritsar, Tirupati, and Bengaluru. Garth Simmons, Accor’s chief operating officer for Asia, emphasized the group’s efforts to cater to India’s dynamic market by bringing global hospitality standards to new locations.

Domestic Market Fuels Expansion

Industry leaders agree that India’s hotel industry is no longer dependent on foreign tourists for growth. Instead, domestic travellers are driving demand across leisure, business, and religious tourism segments. With an expanding middle class, rising disposable incomes, and increased connectivity, Indian travellers are exploring destinations across the country.

Kiran Andicot of Marriott International noted that India’s diverse traveller base is a significant factor shaping the brand’s expansion strategy. Similarly, Hilton’s Zubin Saxena described 2024 as a transformative year, marked by brand launches and new market entries, underscoring the growing importance of the Indian domestic market.

Outlook: A Transforming Landscape

India’s hospitality sector is undergoing a seismic transformation, fuelled by a mix of domestic demand and global investment. As leading players continue to expand their footprints, the sector is expected to cater to an increasingly diverse traveller demographic, ranging from luxury seekers to budget-conscious explorers.

By leveraging this growth momentum, India is positioning itself as a dynamic hub for both global and domestic tourism, creating an unprecedented opportunity for brands to thrive in this burgeoning market.

India’s Hospitality Sector Accelerates: Branded Hotels Surge Amid Robust Domestic Demand
Read More
Technical Analysis of ITC & CRISIL

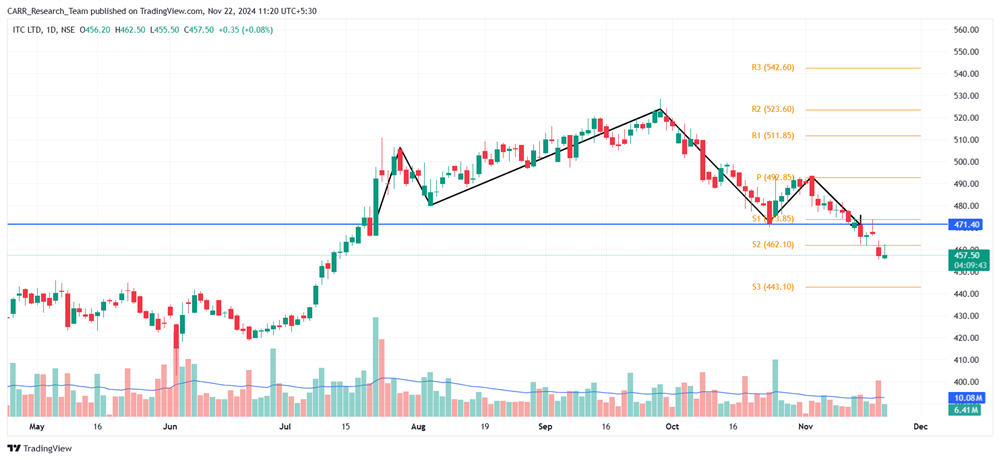
Stock name: ITC Ltd.

Pattern: Head and shoulders pattern

Time frame: Daily

Observation:

Since March 2024, the stock has been trending upward. However, from July to November, it formed a head-and-shoulders pattern on the daily chart, breaking down from the pattern on November 14, 2024. This triggered further declines, marked by a red candle with high trading volume on November 21. Technical analysis suggests that if the current momentum continues, the stock may experience further downside. It's advisable to look for additional confirmations, such as RSI levels and the MACD indicator. Top of FormBottom of FormBottom of Form

You may add this to your watch list to understand further price action.

Disclaimer: This analysis is purely for educational purpose and does not contain any recommendation. Please consult your financial advisor before taking any financial decision.

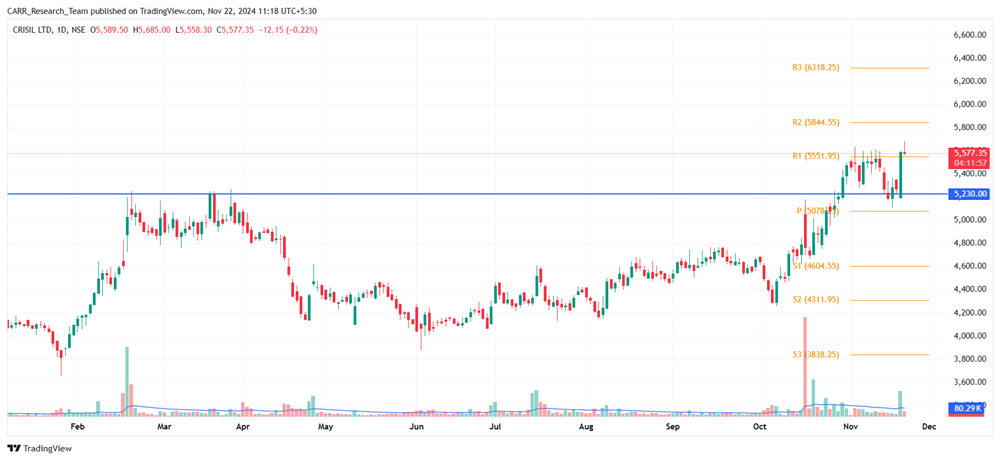
Stock name: CRISIL Ltd.

Pattern: Resistance breakout

Time frame: Daily

Observation:

The stock reached its previous high around March 2024 before cooling off and moving downward. Toward the end of October 2024, it successfully broke out above resistance after multiple unsuccessful attempts. Post-breakout, the stock showed slight upward movement, followed by a retest of the breakout level. On November 21, it formed a strong green candle with significant trading volume. According to technical analysis, if the rebound momentum sustains, the stock may see further upward movement. It's advisable to look for additional confirmations, such as RSI levels and the MACD indicator.

You may add this to your watch list to understand further price action.

Disclaimer: This analysis is purely for educational purpose and does not contain any recommendation. Please consult your financial advisor before taking any financial decision.

Technical Analysis of ITC & CRISIL
Read More
Technical Analysis of BASF & RAMCOCEM

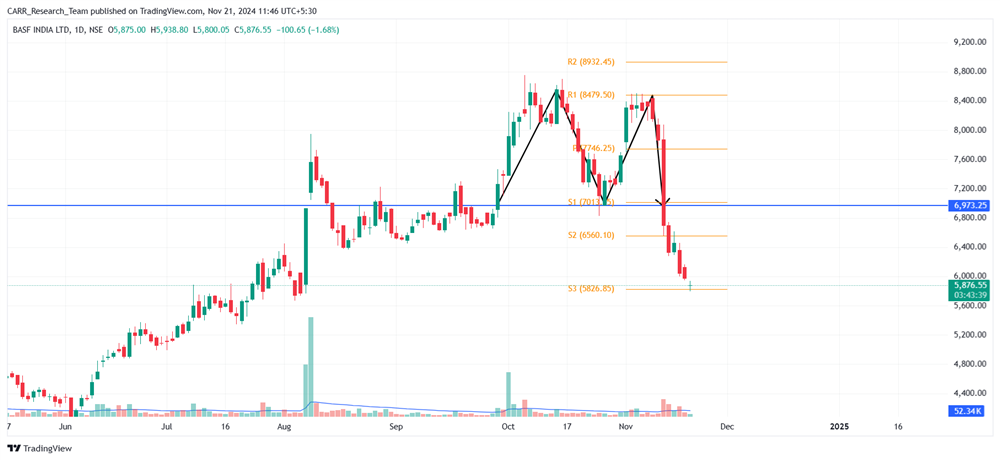
Stock name: BASF India Ltd.

Pattern: Double top pattern

Time frame: Daily

Observation:

The stock experienced a strong upward trend beginning in June 2024. Between September and November 2024, it formed a double-top pattern on the daily chart. On November 12, 2024, the stock saw a major breakdown with high volumes, followed by a subsequent downward movement. Technical analysis suggests that if the current momentum persists, the stock may face further decline. It's advisable to look for additional confirmations, such as RSI levels and the MACD indicator. Top of FormBottom of FormBottom of Form

You may add this to your watch list to understand further price action.

Disclaimer: This analysis is purely for educational purpose and does not contain any recommendation. Please consult your financial advisor before taking any financial decision.

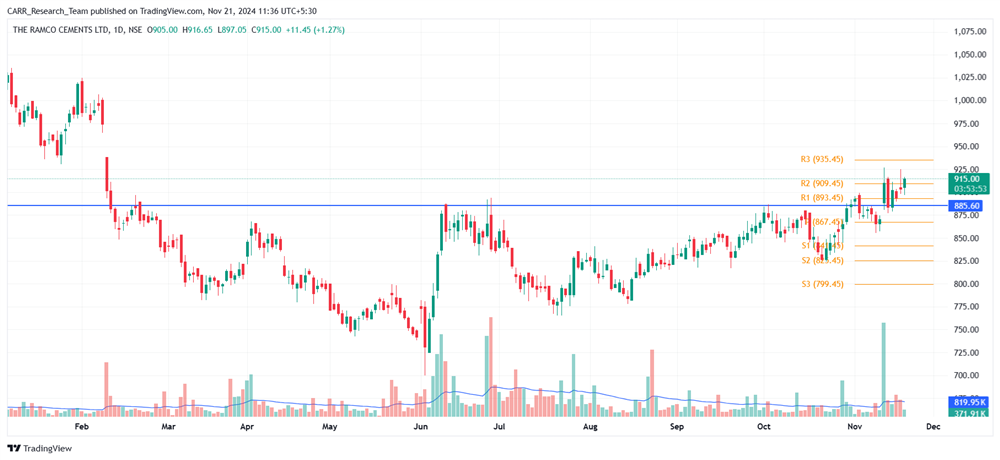
Stock name: The Ramco Cements Ltd.

Pattern: Resistance breakout

Time frame: Daily

Observation:

After reaching a high in December 2023, the stock has cooled down and has seen downward movement. Later on the stock has seen a sideways consolidation from February to November 2024. During this phase, it formed a resistance line, which the stock tested multiple times but failed to decisively break. On November 12, 2024, the stock finally broke out above this level with significant trading volume. It immediately retested the breakout level and managed to stay above it. According to technical analysis, if the stock sustains the breakout momentum, the resistance line may turn into support, and it may lead to upward movement. It's advisable to look for additional confirmations, such as RSI levels and the MACD indicator.

You may add this to your watch list to understand further price action.

Disclaimer: This analysis is purely for educational purpose and does not contain any recommendation. Please consult your financial advisor before taking any financial decision.

Technical Analysis of BASF & RAMCOCEM
Read More
Technical Analysis of BRITANNIA & IOC

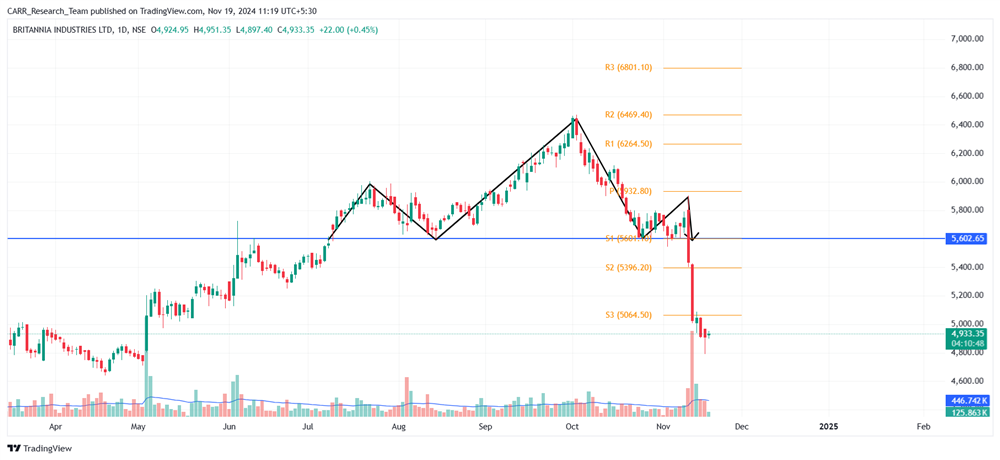
Stock name: Britannia Industries Ltd.

Pattern: Head and shoulders pattern

Time frame: Daily

Observation:

The stock witnessed a significant upward movement starting in April 2024. Between July and November 2024, it formed a head and shoulders pattern on the daily chart. A major breakout with strong volumes occurred on November 11, 2024, followed by a large red candle with even higher volumes. The stock has since continued its downward trend, and technical analysis indicates that the stock may further decline. It's advisable to look for additional confirmations, such as RSI levels and the MACD indicator. Top of FormBottom of FormBottom of Form

You may add this to your watch list to understand further price action.

Disclaimer: This analysis is purely for educational purpose and does not contain any recommendation. Please consult your financial advisor before taking any financial decision.

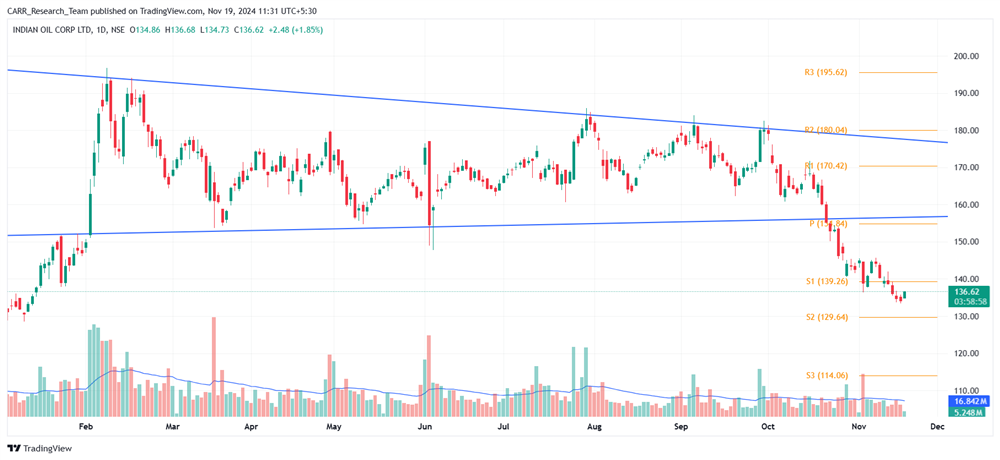
Stock name: Indian Oil Corporation Ltd.

Pattern: Support breakdown

Time frame: Daily

Observation:

From October 2023 to February 2024, the stock experienced a sharp upward trend, followed by a consolidation phase with sideways movement. This resulted in the formation of a parallel channel on the daily chart. By late October 2024, the stock broke below the channel's support line, moving downward with occasional high-volume red candles. Technical analysis suggests that if this momentum persists, the stock may decline further. It's advisable to look for additional confirmations, such as RSI levels and the MACD indicator.

You may add this to your watch list to understand further price action.

Disclaimer: This analysis is purely for educational purpose and does not contain any recommendation. Please consult your financial advisor before taking any financial decision.

Technical Analysis of BRITANNIA & IOC
Read More