Filter
RSS

Blog posts of '2024' 'September'

Technical Analysis of EPL & ASAHIINDIA

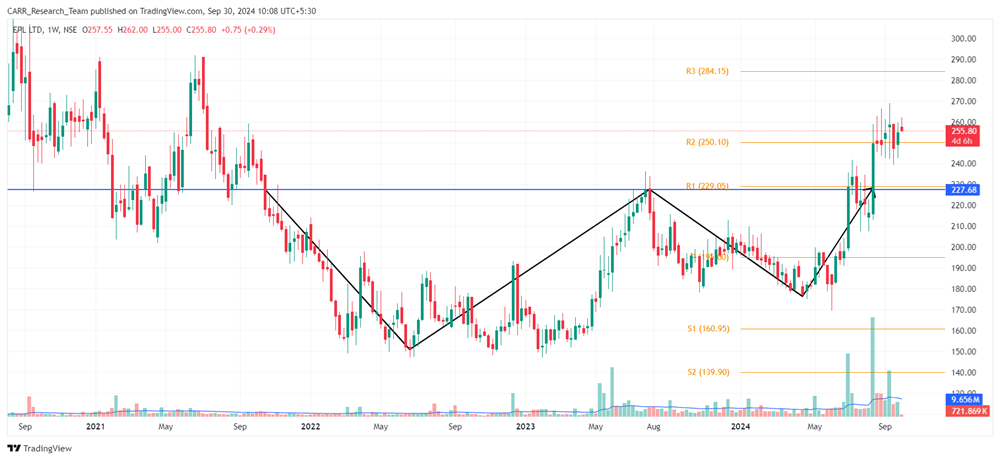
Stock name: EPL Ltd.

Pattern: Double bottom pattern

Time frame: Weekly

Observation:

The stock had been in a downward trend since August 2020 before stabilizing and forming a double bottom pattern on its weekly chart. In August 2024, it broke out of this pattern with solid volume, showing slight upward movement but facing resistance. The stock still needs a strong breakout to overcome this resistance. According to technical analysis, if the stock can maintain upward momentum, it may experience further gains. It's advisable to look for additional confirmations, such as RSI levels and the MACD indicator.

You may add this to your watch list to understand further price action.

Disclaimer: This analysis is purely for educational purpose and does not contain any recommendation. Please consult your financial advisor before taking any financial decision.

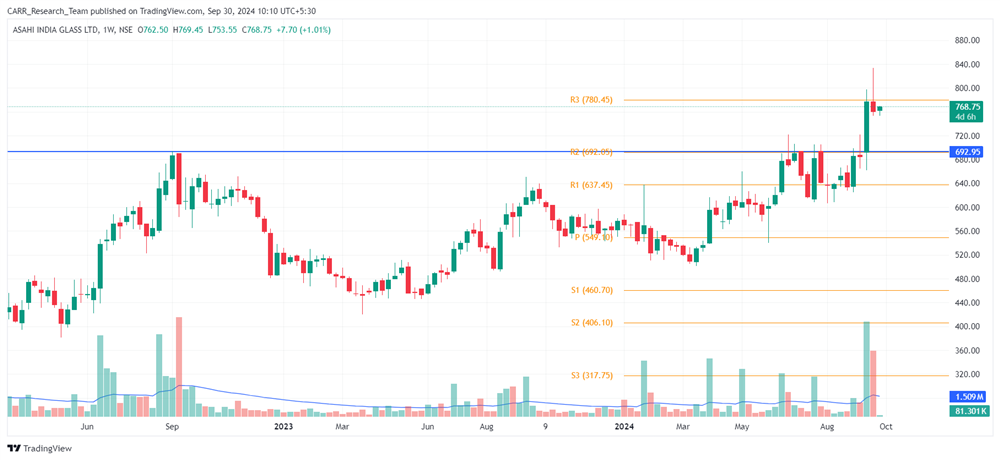
Stock name: Asahi India Glass Ltd.

Pattern: Resistance breakout

Time frame: Weekly

Observation:

The stock experienced a strong upward trend but entered a consolidation phase starting September 2022, facing resistance around the 690-700 levels. In September 2024, it broke through this resistance with significant volume, and the breakout was sustained in the following session. Based on technical analysis, if the stock continues this momentum, it may move further upward. It's advisable to look for additional confirmations, such as RSI levels and the MACD indicator.

You may add this to your watch list to understand further price action.

Disclaimer: This analysis is purely for educational purpose and does not contain any recommendation. Please consult your financial advisor before taking any financial decision.

Technical Analysis of EPL & ASAHIINDIA
Read More
Metal Stocks Surge as China's Property Market Stimulus Fuels Optimism

Shares of metal producers like Tata Steel, Vedanta, JSW Steel, Jindal Steel, NMDC, and National Aluminium rose by as much as 6% on Tuesday, driven by China's new measures to boost its property market. China, the largest consumer of metals globally, is implementing economic policies that are seen as positive for the commodities sector. Among the top gainers were National Aluminium, NMDC, Tata Steel, Vedanta, JSW Steel, and Jindal Steel, which led the rally in metal stocks.

China is the largest consumer of metals and moves to boost economic activity are seen as a positive for commodities. According to reports, China plans to lower interest rates on existing mortgage loans and standardize down payment ratios for mortgage loans. Analysts anticipate that the Chinese government will further reduce the outstanding mortgage rates and ease down payment requirements for second-home buyers. Additionally, there may be opportunities for borrowers to renegotiate or refinance existing mortgages. The government also intends to enhance its re-lending program for state-owned enterprises to help reduce unsold property inventories.

While these measures are expected to spur a short-term rebound in metal prices, analysts remain cautious. The Chinese housing market has been struggling for the past four years, and experts suggest that unless property prices stabilize and unsold inventory decreases, government initiatives may not fully revive the market. Therefore, the rally in metal prices could fall short of expectations, as has happened in the past.

China's new stimulus measures come shortly after the US Federal Reserve implemented a significant interest rate cut, the first in over four years. As China plays a critical role in driving global demand for base metals, its efforts to bolster economic activity could result in increased demand for metals, benefiting investors in the sector.

While the rise in metal stocks is encouraging, analysts urge caution. The sustainability of this rally will depend on the success of China's initiatives and their ability to stabilize the housing market. Investors should remain watchful, as historical trends suggest that short-term rebounds in metal prices often do not meet initial expectations, particularly if broader economic challenges persist.


Metal Stocks Surge as China's Property Market Stimulus Fuels Optimism
Read More
Technical Analysis of JSWINFRA & BAJFINANCE

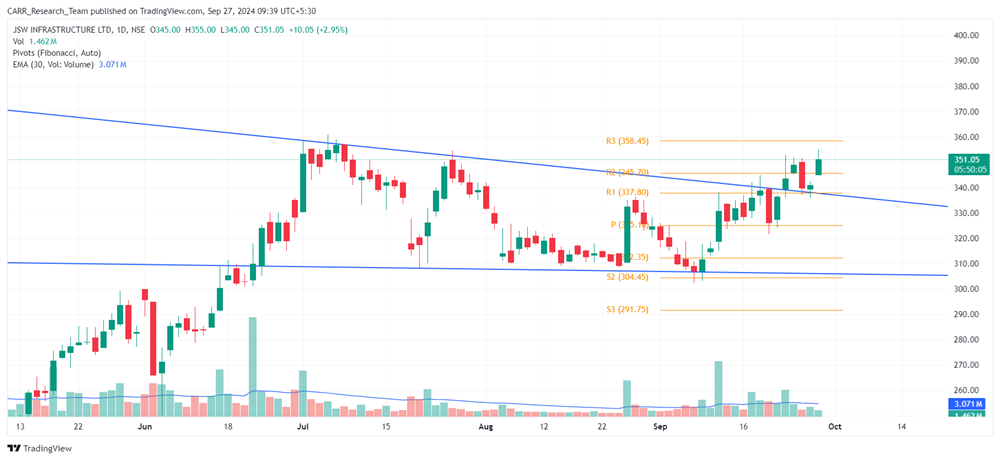
Stock name: JSW Infrastructure Ltd.

Pattern: Falling wedge pattern

Time frame: Daily

Observation:

After reaching an all-time high (ATH), the stock formed a falling wedge pattern on the daily chart from July to September 2024. A breakout occurred on September 23, 2024, supported by strong volume. In the following trading sessions, the stock has maintained its upward momentum. If it continues to hold this momentum, technical analysis suggests that the stock may see further upward movement. It's advisable to look for additional confirmations, such as RSI levels and the MACD indicator.

You may add this to your watch list to understand further price action.

Disclaimer: This analysis is purely for educational purpose and does not contain any recommendation. Please consult your financial advisor before taking any financial decision.

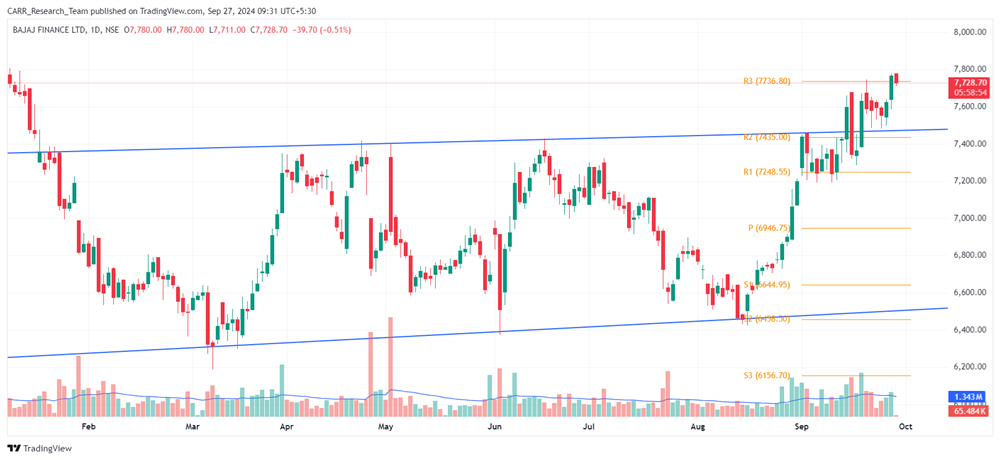
Stock name: Bajaj Finance Ltd.

Pattern: Resistance breakout

Time frame: Daily

Observation:

The stock underwent a prolonged consolidation, moving within a parallel channel from January to September 2024. On September 18, 2024, it broke out of the channel with strong volume. After a brief retest of the breakout level, the stock quickly rebounded. If the current momentum holds, technical analysis suggests that the stock may move further upwards. It's advisable to look for additional confirmations, such as RSI levels and the MACD indicator.

You may add this to your watch list to understand further price action.

Disclaimer: This analysis is purely for educational purpose and does not contain any recommendation. Please consult your financial advisor before taking any financial decision.

Technical Analysis of JSWINFRA & BAJFINANCE
Read More
Technical Analysis of APTUS & HEG

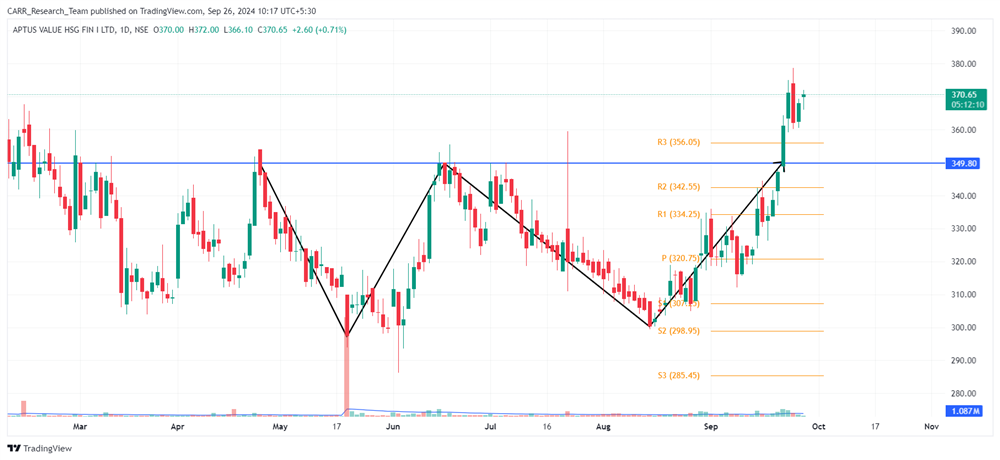
Stock name: Aptus Value Housing Finance India Ltd.

Pattern: Double bottom pattern

Time frame: Daily

Observation:

The stock experienced a downward movement starting in February 2024. Between April and September 2024, it formed a double bottom pattern, with a breakout occurring on 20th September 2024, supported by strong volume. The stock has maintained its position above the breakout level in the following sessions. According to technical analysis, if the momentum persists, the stock may see further upward movement. It's advisable to look for additional confirmations, such as RSI levels and the MACD indicator.

You may add this to your watch list to understand further price action.

Disclaimer: This analysis is purely for educational purpose and does not contain any recommendation. Please consult your financial advisor before taking any financial decision.

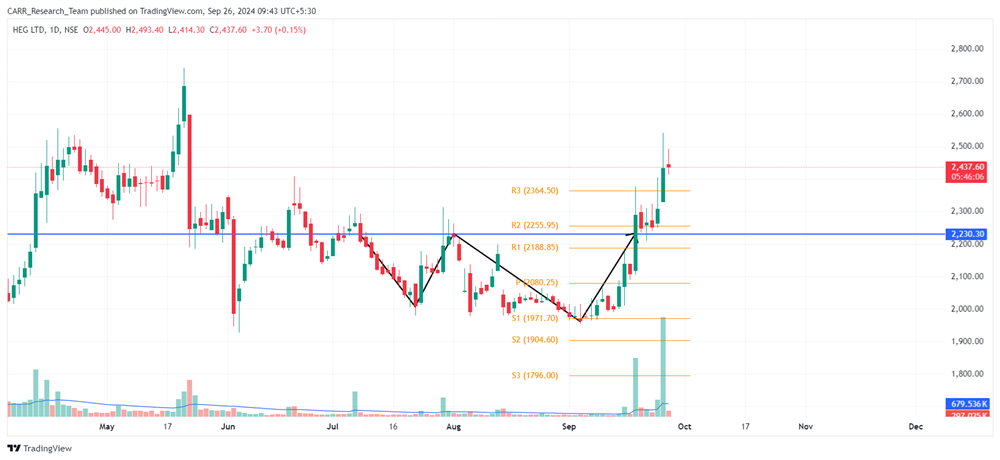
Stock name: H.E.G. Ltd.

Pattern: Double bottom pattern

Time frame: Daily

Observation:

The stock began moving downward in May 2024. Between July and September 2024, it formed a double bottom pattern on the daily chart, breaking out on 18th September 2024 with strong volume. On 25th September 2024, the stock continued its upward movement, again supported by good volume. According to technical analysis, if the breakout momentum holds, it may see further gains. It's advisable to look for additional confirmations, such as RSI levels and the MACD indicator.

You may add this to your watch list to understand further price action.

Disclaimer: This analysis is purely for educational purpose and does not contain any recommendation. Please consult your financial advisor before taking any financial decision.

Technical Analysis of APTUS & HEG
Read More
Technical Analysis of BLUESTARCO & LINDEINDIA

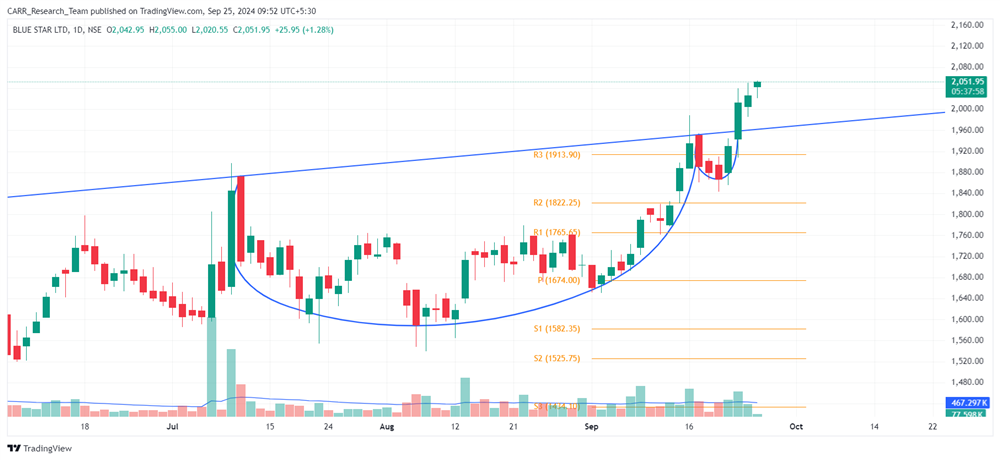
Stock name: Blue Star Ltd.

Pattern: Cup and handle pattern

Time frame: Daily

Observation:

The stock has been in a prolonged uptrend and formed a cup and handle pattern between June and September 2024 on the daily chart. A breakout occurred on 23rd September 2024, backed by good trading volume, with the stock holding above the breakout level and continuing to rise. According to technical analysis, if the stock sustains this breakout, it may see further upward movement. It's advisable to look for additional confirmations, such as RSI levels and the MACD indicator.

You may add this to your watch list to understand further price action.

Disclaimer: This analysis is purely for educational purpose and does not contain any recommendation. Please consult your financial advisor before taking any financial decision.


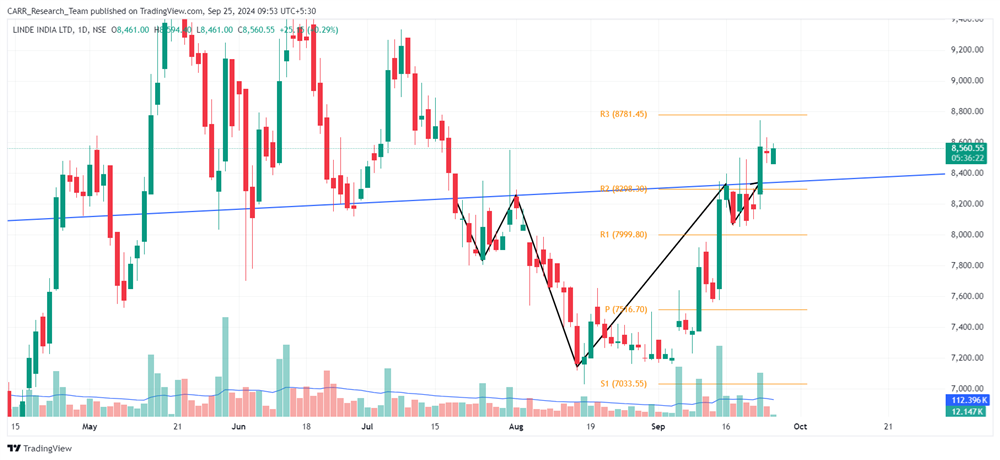
Stock name: Linde India Ltd.

Pattern: Inverse head and shoulders pattern

Time frame: Daily

Observation:

The stock has seen some cooling off from its ATH since May 2024. During the period from July 2024 to September 2024, the stock has formed an inverse head and shoulders pattern. The stock has registered a breakout from the pattern on 23rd September 2024 which was supported by a good volume. The stock has managed to hold above the breakout level in the subsequent trading sessions. As per technical analysis, if the breakout momentum continues, the stock may see further gains. It's advisable to look for additional confirmations, such as RSI levels and the MACD indicator.

You may add this to your watch list to understand further price action.

Disclaimer: This analysis is purely for educational purpose and does not contain any recommendation. Please consult your financial advisor before taking any financial decision.

Technical Analysis of BLUESTARCO & LINDEINDIA
Read More
Technical Analysis of ISEC & LODHA

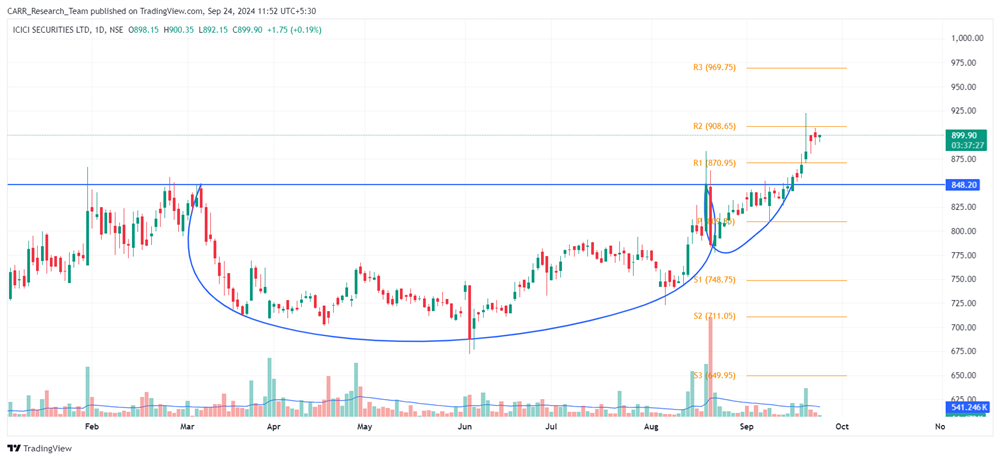
Stock name: ICICI Securities Ltd.

Pattern: Cup and handle pattern

Time frame: Daily

Observation:

The stock has been trending upward. It has consolidated from March to September 2024, forming a cup and handle pattern on its daily chart. A breakout occurred on 16th September 2024, followed by continued upward movement. The candlestick on 19th September also showed strong volume support. Though the stock has breached its previous ATH at around 890 levels, it is yet to register a breakout from this level with strong volume. According to technical analysis, if the stock gains on a strong momentum, it may see further gains. It's advisable to look for additional confirmations, such as RSI levels and the MACD indicator.

You may add this to your watch list to understand further price action.

Disclaimer: This analysis is purely for educational purpose and does not contain any recommendation. Please consult your financial advisor before taking any financial decision.

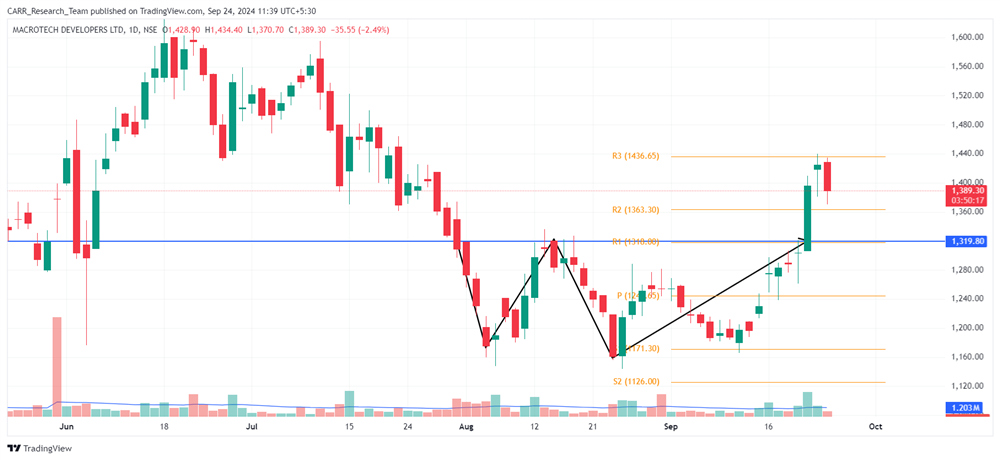
Stock name: Macrotech Developers Ltd.

Pattern: Double bottom pattern

Time frame: Daily

Observation:

The stock has seen some cooling off from its ATH since June 2024 but stabilized between July and September, forming a double bottom pattern on the daily chart. It broke out of this pattern on 20th September 2024 with strong volume and sustained the breakout level on Monday. If the breakout momentum continues, the stock may see further gains according to technical analysis. It's advisable to look for additional confirmations, such as RSI levels and the MACD indicator.

You may add this to your watch list to understand further price action.

Disclaimer: This analysis is purely for educational purpose and does not contain any recommendation. Please consult your financial advisor before taking any financial decision.

Technical Analysis of ISEC & LODHA
Read More
Technical Analysis of QUESS & FLUOROCHEM

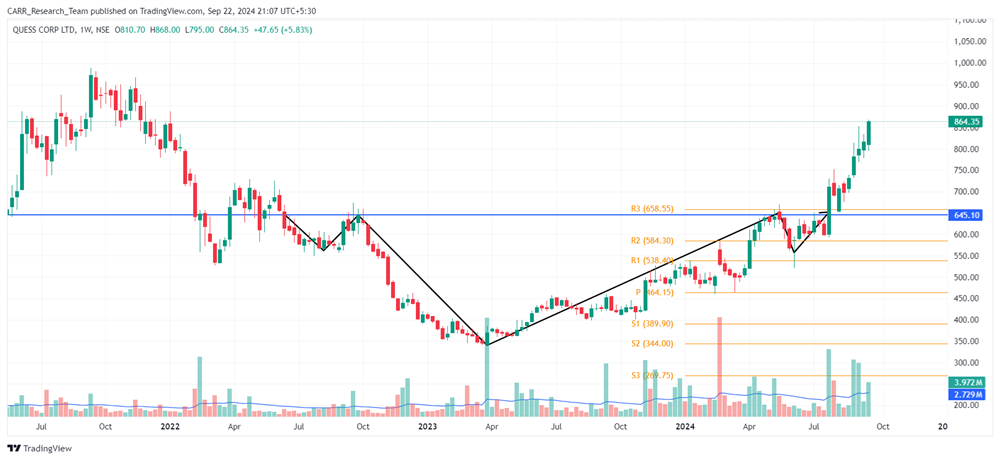
Stock name: Quess Corp Ltd.

Pattern: Inverse head and shoulders pattern

Time frame: Weekly

Observation:

The stock has been in a downward trend since September 2021. Between June 2022 and July 2024, it formed an inverse head and shoulders pattern on the weekly chart. A breakout occurred at the end of July 2024, supported by high volume, followed by upward movement with strong volumes. According to technical analysis, if the momentum continues, the stock may see further upward. It's advisable to look for additional confirmations, such as RSI levels and the MACD indicator.

You may add this to your watch list to understand further price action.

Disclaimer: This analysis is purely for educational purpose and does not contain any recommendation. Please consult your financial advisor before taking any financial decision.

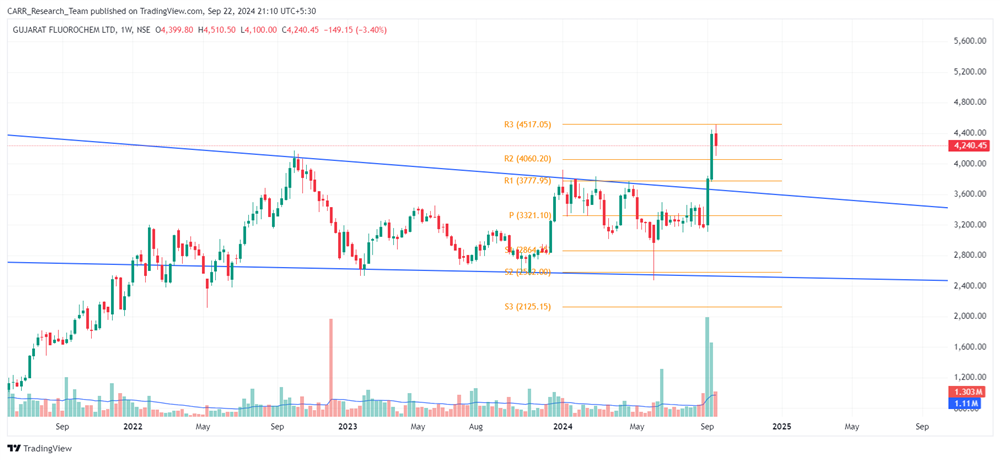
Stock name: Gujarat Fluorochemicals Ltd.

Pattern: Falling wedge pattern

Time frame: Weekly

Observation:

The stock has been forming a downward wedge pattern from June 2022 to September 2024 on the weekly chart. It broke out of the pattern in early September 2024 with high volume. Following the breakout, a confirmation candle with strong volume appeared, and the stock sustained its level on the third candle. If momentum holds, the stock may move further upward according to technical analysis. It's advisable to look for additional confirmations, such as RSI levels and the MACD indicator.

You may add this to your watch list to understand further price action.

Disclaimer: This analysis is purely for educational purpose and does not contain any recommendation. Please consult your financial advisor before taking any financial decision.

Technical Analysis of QUESS & FLUOROCHEM
Read More
NTPC Green and HDB Financial Services IPO

Didn’t get the Bajaj Housing Finance IPO allotment? Don’t worry! The current IPO market is buzzing with excitement, and there are two significant IPOs set to hit the bourses soon—NTPC Green Energy Ltd, a subsidiary of state-run NTPC, and HDB Financial Services, a subsidiary of HDFC Bank. Owning the shares of the parent entity can improve your chances for allotment of the subsidiary.

NTPC Green Energy Ltd (NGEL)

NTPC Green Energy Ltd has filed its draft red herring prospectus (DRHP) to raise Rs 10,000 crore through an IPO. This share sale will consist entirely of a fresh issue of shares, with no offer-for-sale (OFS) component. Retail investors have much to gain from this offering, particularly those who already hold NTPC Ltd shares. Shareholders of NTPC Ltd are eligible to bid under a special shareholder category, allowing them to invest up to Rs 4 lakh, double the usual Rs 2 lakh limit available to retail investors.

Incorporated in 2022, NTPC Green Energy is a wholly-owned subsidiary of NTPC Ltd, a ‘Maharatna’ public sector enterprise. The company operates renewable energy projects, including solar and wind power assets, across more than six states in India. As of August 31, 2024, NTPC Green Energy had an operational capacity of 3,071 MW from solar projects and 100 MW from wind projects. These projects feed renewable energy into the national grid, supplying power to utilities and other off-takers under long-term Power Purchase Agreements (PPAs) or Letters of Award (LoAs). The company has ambitious growth plans, aiming to add about 60 GW of renewable capacity by 2032, representing roughly 15% of India’s renewable energy capacity.

NTPC Green Energy is also at the forefront of developing Round-the-Clock (RTC) renewable energy projects, which provide consistent energy supply from renewable sources. The company is working on 2.7 GW of RTC capacity, including a massive 1.3 GW RTC project, one of the largest in the world. These efforts place NTPC Green Energy among the top 10 renewable energy companies in India in terms of operational capacity as of June 30, 2024.

NTPC Green Energy’s portfolio as of June 30, 2024, comprised 14,696 MW of solar and wind projects, spread across multiple geographies. The company is diversified in terms of both location and its client base, with 15 off-takers spanning 37 solar projects and nine wind projects. As India’s largest renewable energy public sector enterprise (excluding hydro), NTPC Green Energy is poised to capitalize on the growing demand for clean energy. Its strong credit ratings, coupled with stable and growing revenues, have allowed the company to access low-cost capital for its projects.

With the backing of NTPC Ltd, which has extensive experience in managing large-scale projects and maintaining strong relationships with suppliers and off-takers, NTPC Green Energy is well-positioned for continued growth in the renewable energy sector.

HDB Financial Services (HDBFS)

HDB Financial Services, another eagerly awaited IPO, is expected to raise significant capital soon. Although the company has yet to file its red herring prospectus (RHP), it has established itself as a prominent player in India’s financial services sector. HDBFS is a non-banking financial company (NBFC) that primarily serves the retail and commercial segments, offering a wide range of products such as secured and unsecured loans, asset finance, consumer loans, and loans against property.

HDBFS has experienced steady growth, with its loan book increasing by 17% year-on-year for FY23, reaching Rs 66,000 crore. This growth has been driven by strong demand for personal loans, vehicle loans, and small business financing. The company’s financial performance has been solid, reporting a net profit of Rs 1,740 crore in FY23. HDFC Bank, which holds a majority stake in HDBFS, is seeking a valuation between Rs 78,000 crore and Rs 87,000 crore for the company. The upcoming IPO could see HDFC Bank offloading 10-15% of its stake in HDBFS, raising Rs 7,800-8,700 crore. These funds would boost the bank’s capital adequacy ratio, which stood at 19.3% as of June 2024.

The decision to list HDB Financial Services comes in response to the Reserve Bank of India's mandate requiring NBFCs in the "upper layer" to go public. This IPO follows closely after the successful listing of Bajaj Housing Finance, which saw its market capitalization exceed Rs 1.4 lakh crore.

In summary, while missing out on Bajaj Housing Finance’s IPO might be disappointing, the upcoming NTPC Green Energy and HDB Financial Services IPOs offer promising opportunities for investors looking to capitalize on the current IPO boom. Both companies have strong growth potential, making their initial public offerings highly anticipated in the Indian stock market.

NTPC Green and HDB Financial Services IPO
Read More
Technical Analysis of BIKAJI & CAMPUS

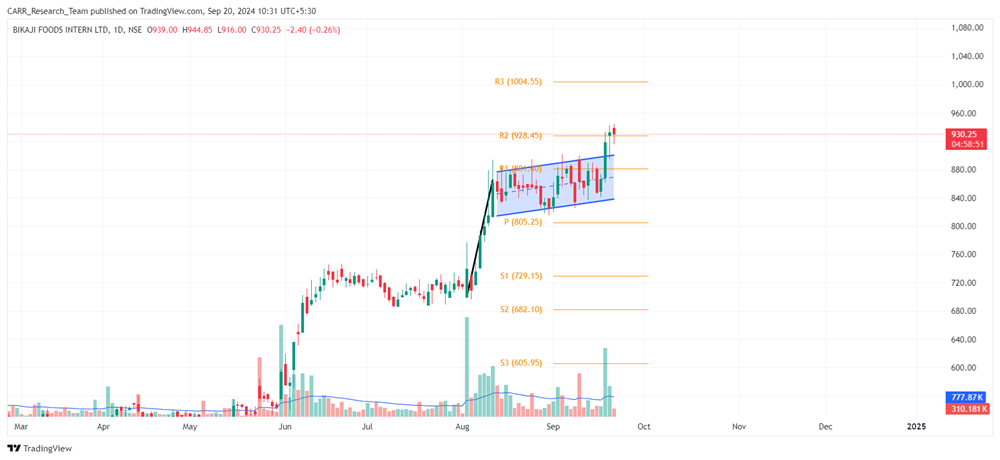
Stock name: Bikaji Foods International Ltd.

Pattern: Flag and pole pattern

Time frame: Daily

Observation:

In August 2024, the stock saw a sharp rise, followed by a consolidation phase from 13th August to 18th September, forming a flag and pole pattern on the daily chart. A breakout occurred on 18th September, supported by strong trading volume, and the stock maintained this level in the next session. Technical analysis suggests that if the stock sustains this momentum, it may move further upward. It's advisable to look for additional confirmations, such as RSI levels and the MACD indicator.

You may add this to your watch list to understand further price action.

Disclaimer: This analysis is purely for educational purpose and does not contain any recommendation. Please consult your financial advisor before taking any financial decision.

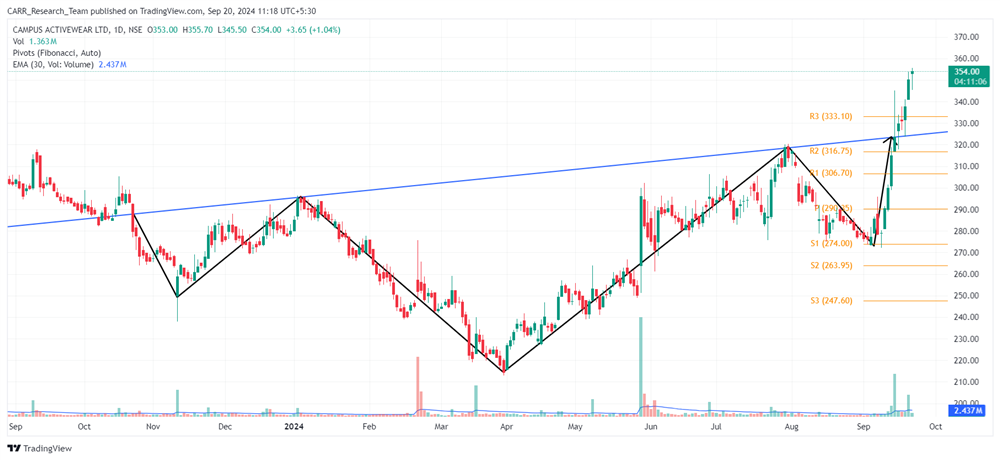
Stock name: Campus Activewear Ltd.

Pattern: Inverse head and shoulders pattern

Time frame: Daily

Observation:

The stock has been in a downward trend since October 2022 but stabilized from October 2023 to September 2024, forming an inverse head and shoulders pattern. A breakout occurred on 13th September 2024, followed by upward movement supported by strong volume on 19th September 2024. Technical analysis suggests that if the stock sustains this momentum, it may see further gains. It's advisable to look for additional confirmations, such as RSI levels and the MACD indicator.

You may add this to your watch list to understand further price action.

Disclaimer: This analysis is purely for educational purpose and does not contain any recommendation. Please consult your financial advisor before taking any financial decision.

Technical Analysis of BIKAJI & CAMPUS
Read More