Stock name: Abbott India Ltd.
Pattern: Support breakdown
Time frame: Daily
Observation:
Since January 2024, the stock has been moving within a parallel channel on its daily chart. In January 2025, it reached the channel’s support and, after multiple attempts, broke down on January 24. This was followed by consecutive red candles, with the January 28 candle showing significant volume support. If the current momentum continues, the stock may see further decline as per technical analysis. It's advisable to look for additional confirmations, such as RSI levels and the MACD indicator.
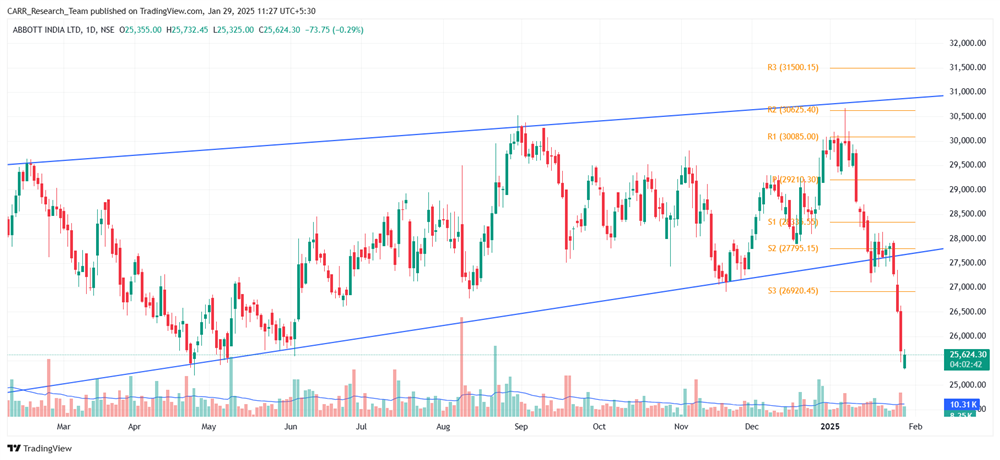
You may add this to your watch list to understand further price action.
Disclaimer: This analysis is purely for educational purpose and does not contain any recommendation. Please consult your financial advisor before taking any financial decision.

Stock name: Sterling and Wilson Renewable Energy Ltd.
Pattern: Head and shoulders pattern
Time frame: Daily
Observation:
Since October 2023, the stock has been in an uptrend but formed a head and shoulders pattern on the daily chart. A breakdown occurred around November 12, 2024, followed by a brief sideways movement. On January 17, 2025, the stock saw a sharp decline with increased trading volume. If the current momentum persists, it may further decline as per technical analysis. It's advisable to look for additional confirmations, such as RSI levels and the MACD indicator.
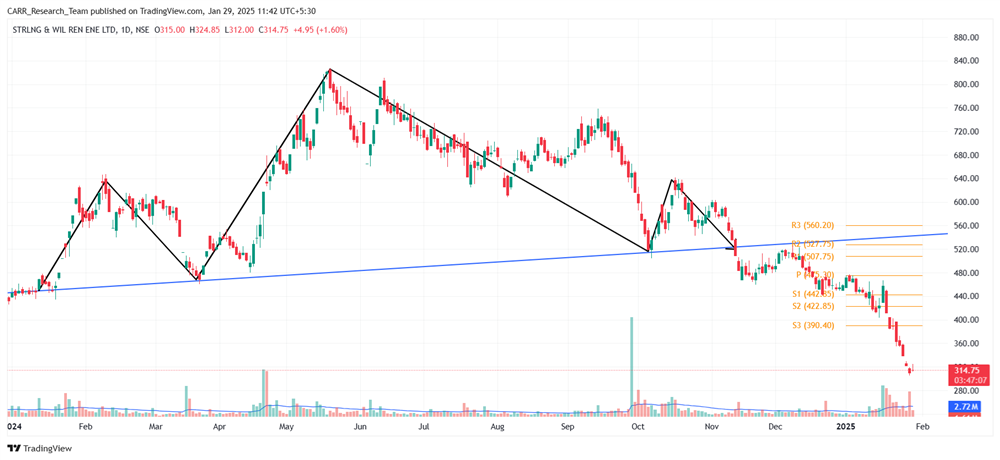
You may add this to your watch list to understand further price action.
Disclaimer: This analysis is purely for educational purpose and does not contain any recommendation. Please consult your financial advisor before taking any financial decision.