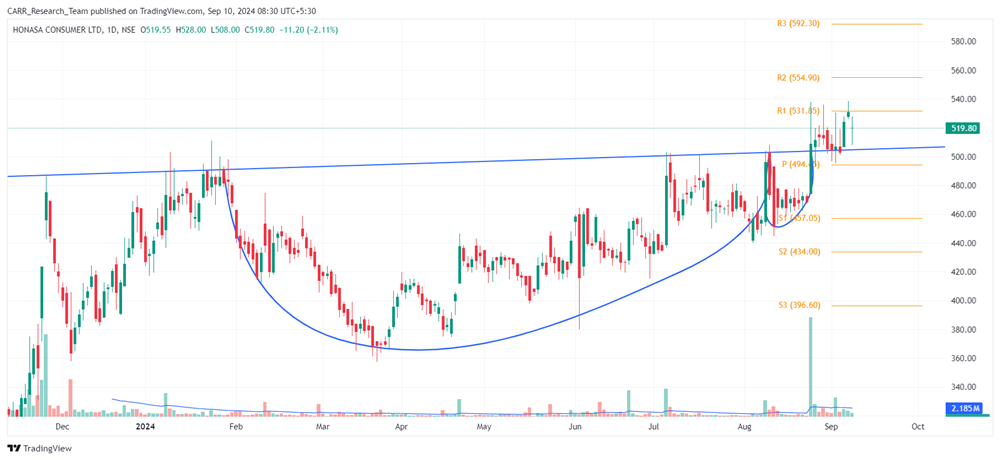
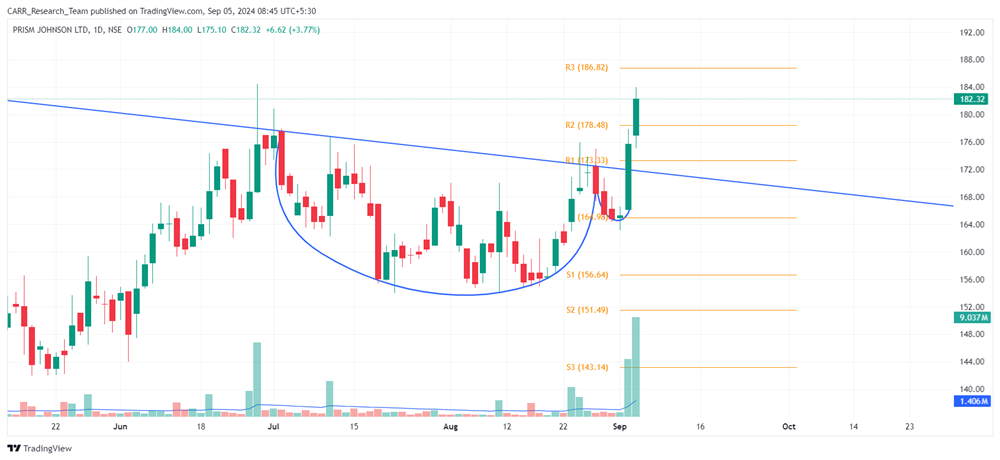
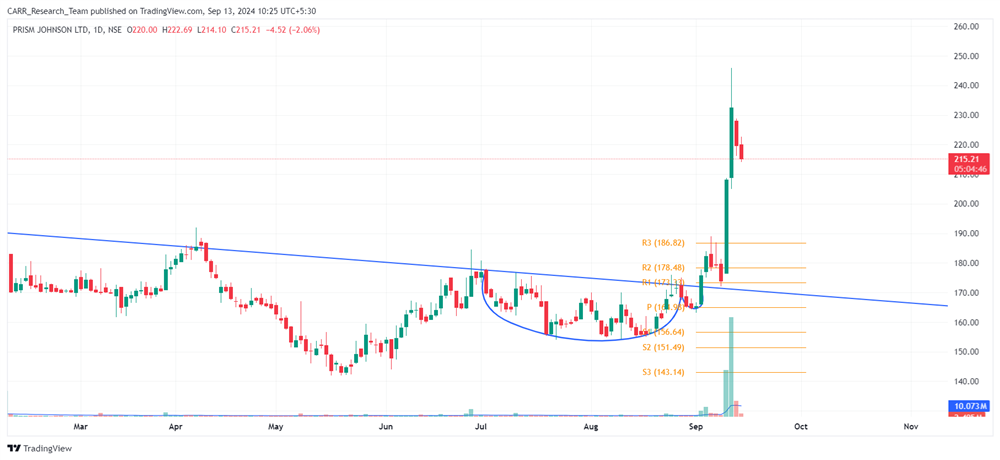
Stock name: Prism Johnson Ltd.
Pattern: Cup and handle pattern
Time frame: Daily
Observation:
According to the TA blog from September 5, 2024 (link for reference), the stock formed a cup and handle pattern on its daily chart and registered a breakout on September 3, supported by strong trading volume. After the breakout, the stock briefly retested the breakout level but rebounded sharply on September 10 and 11. Between September 5 and 11, 2024, the stock surged over 25%.
You may add this to your watch list to understand further price action.
Disclaimer: This analysis is purely for educational purpose and does not contain any recommendation. Please consult your financial advisor before taking any financial decision.

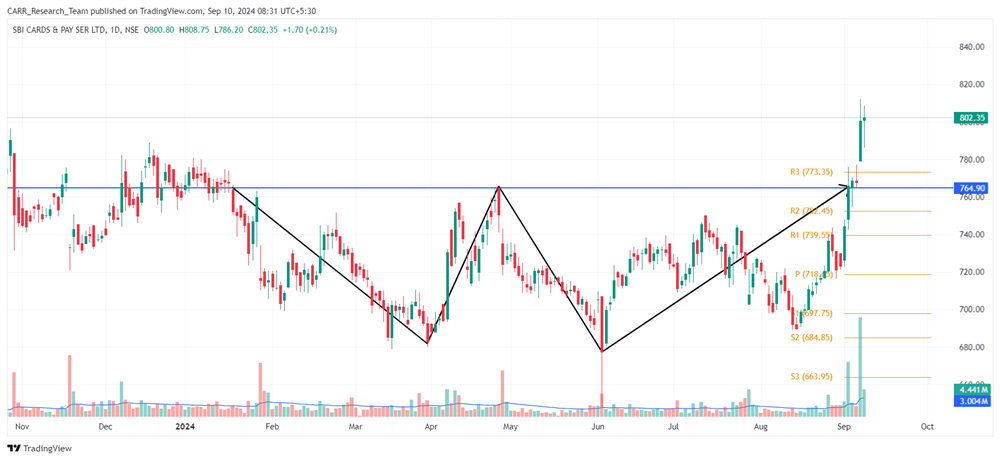
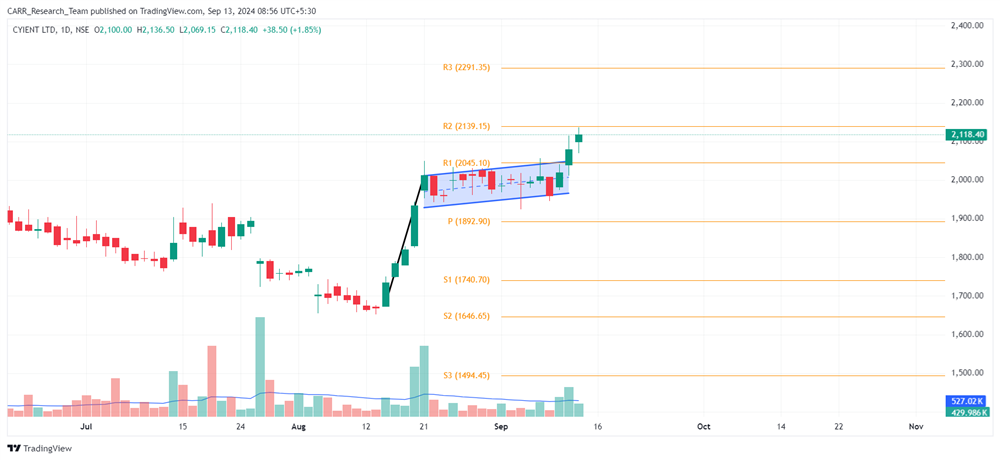
Stock name: Cyient Ltd.
Pattern: Flag and pole pattern
Time frame: Daily
Observation:
The stock experienced a strong rise in August 2024, stabilizing from August 21. This created a flag and pole pattern on its daily chart, followed by a breakout on September 11, 2024, backed by high trading volume. The next candle confirmed the breakout, and if the stock sustains this momentum, it may see further upward movement according to technical analysis. It's advisable to look for additional confirmations, such as RSI levels and the MACD indicator.
You may add this to your watch list to understand further price action.
Disclaimer: This analysis is purely for educational purpose and does not contain any recommendation. Please consult your financial advisor before taking any financial decision.